HomeRiskIQ · Published October 24, 2026
What annual flood-day totals leave out
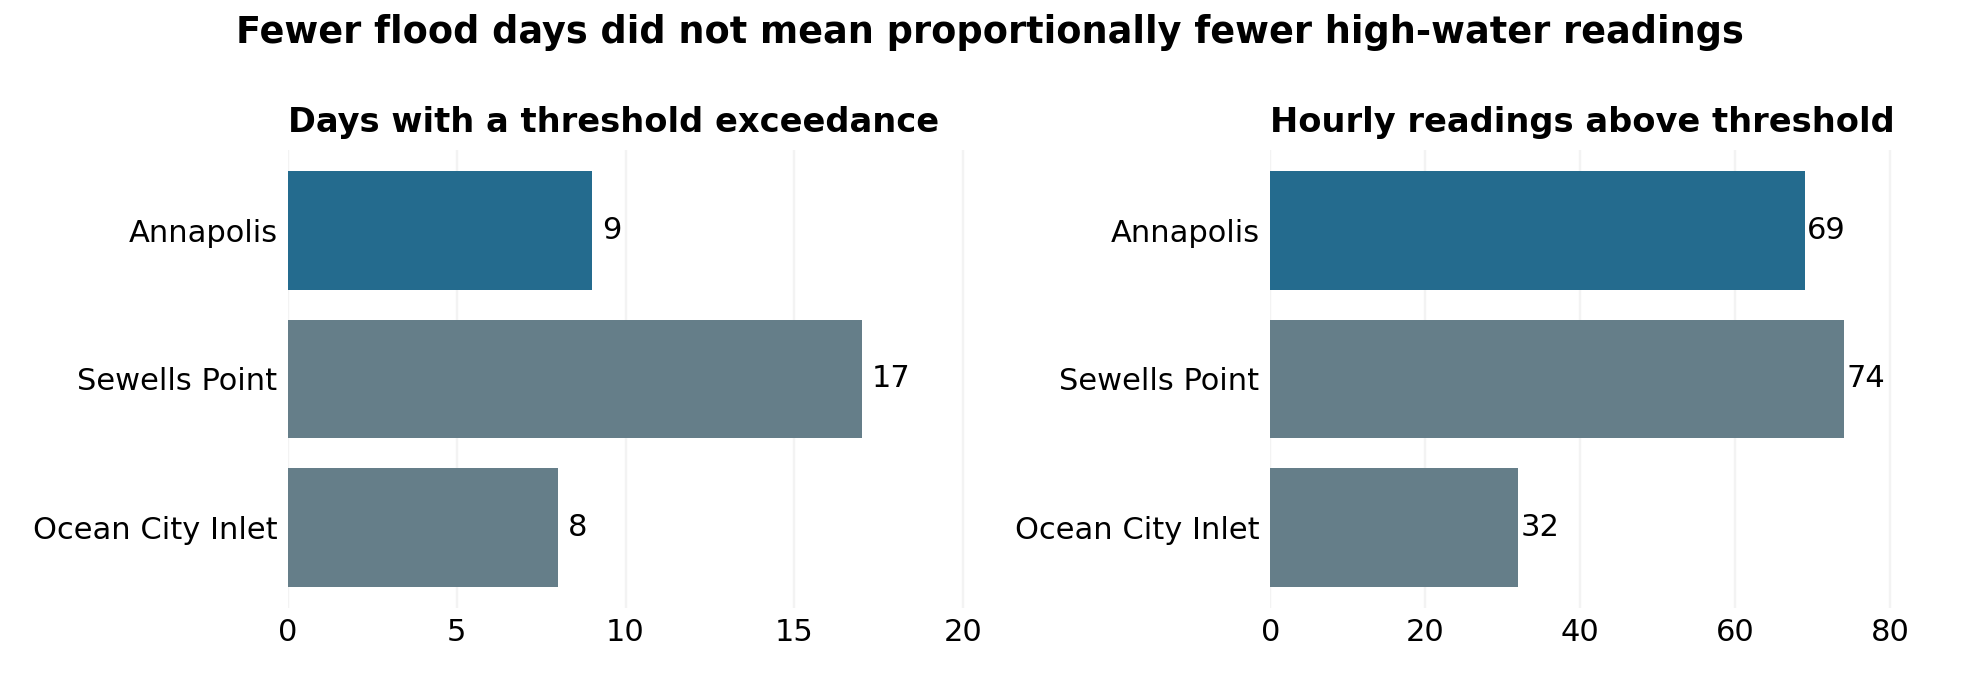
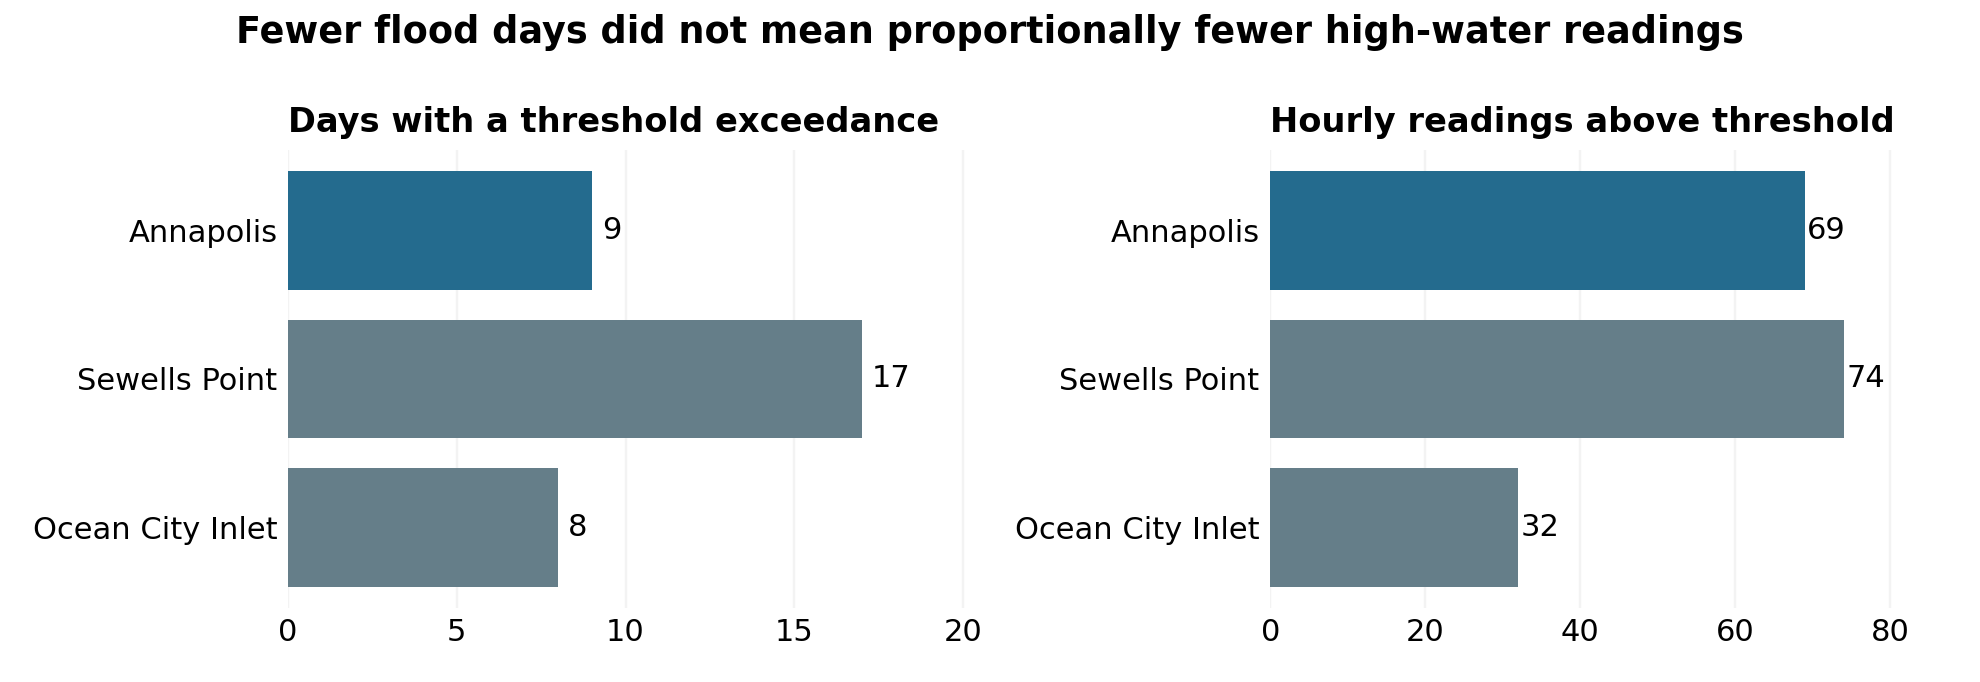
A three-gauge comparison of NOAA observations from May 1, 2025 through April 30, 2026 shows why annual flood-day totals are only part of the high-water story. Annapolis recorded 9 days above the NOAA National Ocean Service minor threshold, compared with 17 at Sewells Point, Virginia. Yet Annapolis had almost as many above-threshold hourly readings: 69 versus 74. Ocean City Inlet recorded 8 days and 32 readings. [1, 2, 3]
Sampled gauge persistence. These are water-level observations at gauges, not counts of flooded homes, road closures or damage. Hourly readings describe sampled persistence. They do not establish that flooding continued throughout every interval between samples.
Two measures, separate scales
The distinction behind the numbers
| Gauge (station ID) | Threshold days (UTC) | Hourly readings above threshold | Longest run (consecutive readings) |
|---|---|---|---|
| Annapolis (8575512) | 9 | 69 | 21 |
| Sewells Point (8638610) | 17 | 74 | 9 |
| Ocean City Inlet (8570283) | 8 | 32 | 6 |
A day contributes one to the annual total whether the gauge exceeds its threshold briefly or at many hourly sample times. In this year, Annapolis had 53% as many threshold-exceedance days as Sewells Point but 93% as many above-threshold hourly readings. Annapolis and Ocean City Inlet had similar day counts, but Annapolis had more than twice as many above-threshold hourly readings.
The original contribution is this matched-year, three-station comparison, its run-length analysis and its concentration checks. The broader idea that frequency and duration are different is established: Annapolis already publishes flood frequency and duration information using a different local threshold. This analysis is not a discovery that NOAA day counts are wrong. [4]
Annapolis · October 30, 2025
One long window matters
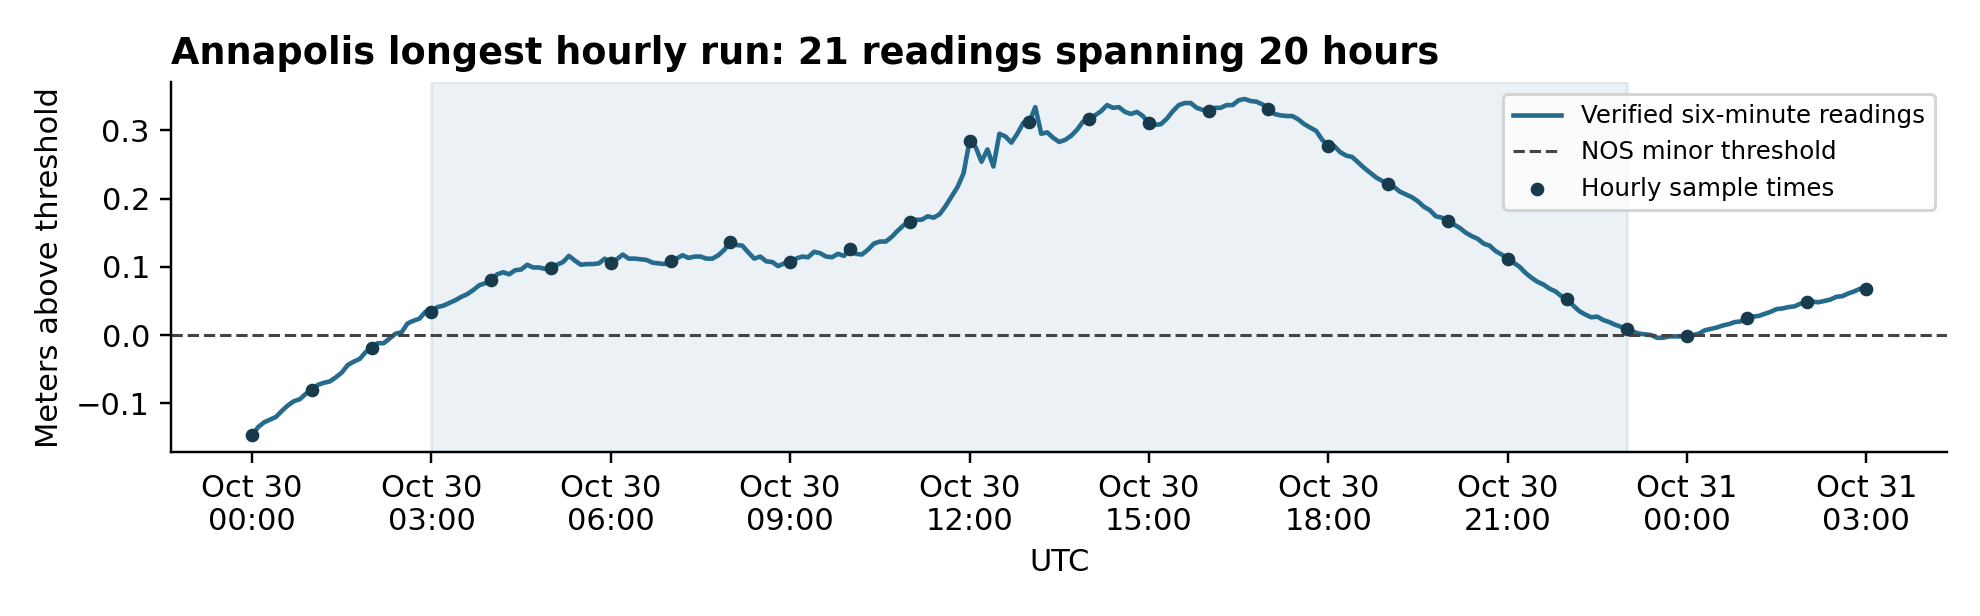
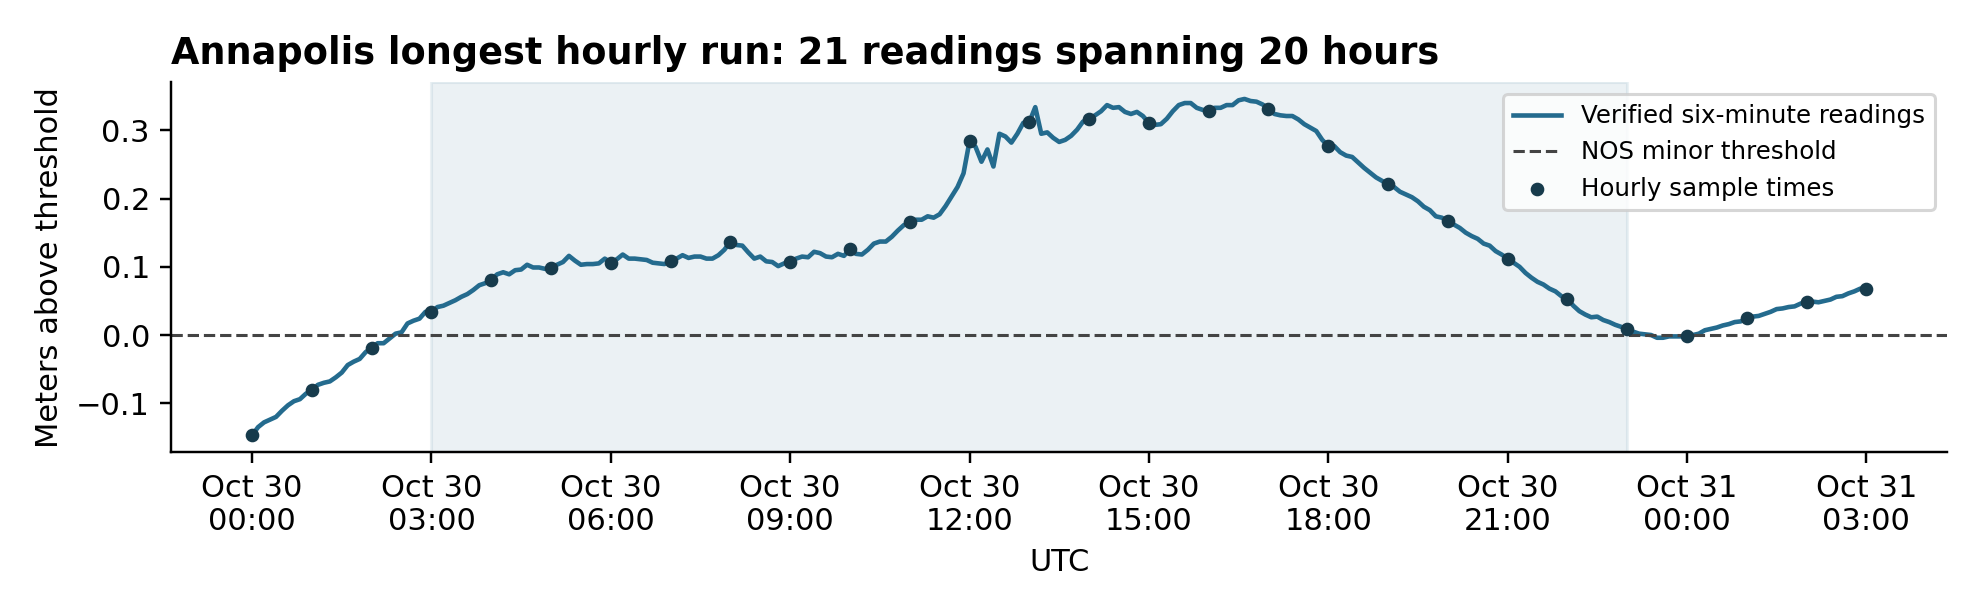
Annapolis had a maximum run of 21 consecutive above-threshold hourly readings, from 03:00 to 23:00 UTC on October 30, 2025. Those sample times span 20 elapsed hours, not 21 proven continuous flood hours. The corresponding maxima were 9 consecutive readings at Sewells Point and 6 at Ocean City Inlet.
Read the episode timeline as a table
The chart’s hourly markers are the six-minute product sampled on the hour. Positive values exceed the 2.333 m STND threshold; zero or negative values do not. The full six-minute record is in the evidence archive.
| Timestamp (UTC) | Meters above NOS minor threshold |
|---|---|
| -0.147 | |
| -0.081 | |
| -0.019 | |
| 0.034 | |
| 0.081 | |
| 0.098 | |
| 0.106 | |
| 0.109 | |
| 0.137 | |
| 0.107 | |
| 0.126 | |
| 0.165 | |
| 0.284 | |
| 0.312 | |
| 0.316 | |
| 0.311 | |
| 0.329 | |
| 0.332 | |
| 0.277 | |
| 0.221 | |
| 0.167 | |
| 0.112 | |
| 0.053 | |
| 0.009 | |
| -0.002 | |
| 0.025 | |
| 0.049 | |
| 0.068 |
The annual contrast is concentrated, rather than evenly spread through the year. October 30–31 accounts for 27 of Annapolis’s 69 above-threshold hourly readings, or 39%. Adding October 2 brings the total to 42, or 61%. These are calendar windows, not independently classified storms. The analysis does not attribute the readings to a particular weather system or estimate a trend from one year.
A local reporting question rather than a damage estimate
The useful question is what a community needs to know beyond an annual day total: whether high-water readings occur in brief clusters or persist across many sample times. Local records can then establish what actually happened on roads and waterfronts. They cannot be inferred from the gauge alone.
For example, Ocean City’s October 14, 2025 storm recap reported road closures south of Route 50, but no significant structural damage or injuries. That is evidence of disruption during that event, not a duration estimate for those closures. Annapolis’s August 2026 City Dock update distinguishes tidal backflow from rainfall flooding and describes ongoing resilience work. Neither source establishes that a particular gauge reading caused an impact, nor that this analysis measures project effectiveness. [5, 6]
How stable is the comparison?
Moving each NOS threshold down or up by one centimeter leaves Annapolis with more above-threshold readings than Ocean City Inlet and a longer maximum run than either comparator. Annapolis ranges from 60 to 78 readings and a maximum run of 20 to 28; Sewells Point from 71 to 83 and a maximum of 9; Ocean City Inlet from 28 to 37 and a maximum of 6. Exact run lengths are threshold-sensitive. The near-equality between Annapolis and Sewells Point is a descriptive observation, not a formal equivalence test or risk ranking.
Inspect the ±1 cm threshold sensitivity
| Gauge | Shift (m) | Threshold (m STND) | Days (UTC) | Hourly readings | Longest run (readings) |
|---|---|---|---|---|---|
| Annapolis | -0.01 | 2.323 | 11 | 78 | 28 |
| Annapolis | 0 | 2.333 | 9 | 69 | 21 |
| Annapolis | 0.01 | 2.343 | 9 | 60 | 20 |
| Sewells Point | -0.01 | 2.700 | 18 | 83 | 9 |
| Sewells Point | 0 | 2.710 | 17 | 74 | 9 |
| Sewells Point | 0.01 | 2.720 | 17 | 71 | 9 |
| Ocean City Inlet | -0.01 | 3.725 | 8 | 37 | 6 |
| Ocean City Inlet | 0 | 3.735 | 8 | 32 | 6 |
| Ocean City Inlet | 0.01 | 3.745 | 7 | 28 | 6 |
Frozen source snapshot · October 23, 2026
Methods and definitions
Period and sampling
The frozen analysis covers 8,760 hourly timestamps per gauge, from May 1, 2025 at 00:00 through April 30, 2026 at 23:00 UTC. Each series has every expected timestamp, no duplicates and no empty water levels. NOAA hourly_height is the primary product.
Threshold and datum
Water levels were requested in meters relative to station datum (STND). The NOS minor threshold snapshot retrieved October 23, 2026 is 2.333 m at Annapolis, 2.710 m at Sewells Point and 3.735 m at Ocean City Inlet. These are station-specific datum values, not directly comparable elevations. Metadata do not provide a threshold revision history. Applying this snapshot exactly reproduces all daily minor flags and counts in the downloaded NOAA daily product; historical constancy is not assumed.
NOS versus NWS
NOS thresholds support nationally consistent comparisons. NWS impact thresholds serve local warning purposes and reflect local conditions; they need not match NOS thresholds. This analysis does not apply current NWS thresholds to historical records to estimate warning frequency. [2, 7]
Exceedance rule
A reading must be strictly greater than its threshold, not equal to it. A threshold day has at least one such hourly reading. The script reproduces every daily maximum and the 9, 17 and 8 minor-day counts in NOAA’s daily product. UTC is the explicit convention of this analysis. It is not presented as a verified universal NOAA date convention; local-calendar aggregation can change day counts.
Quality and runs
Annapolis and Ocean City each have two hourly observations with nonzero flags; Sewells Point has nine. None exceed the tested thresholds. Runs include only unflagged, above-threshold observations spaced exactly one hour apart. They break at a non-exceedance, nonzero flag, missing observation or nonconsecutive timestamp, but not at midnight. The six-minute check uses verified observations with zero flags.
Limits
Sample counts are not continuous inundation hours. Gauges do not measure flooded properties, infrastructure access, people affected, losses or insured risk. Three selected stations and one year do not establish a regional ranking or trend. Station-specific thresholds do not imply equal consequences. No projection or annual outlook is mixed into these observed counts.
Calculations use exact Decimal comparisons for the strict greater-than rule. The fixed source checksums, completeness, daily reconciliation and six-minute interval checks passed on reproduction. This study does not change HomeRiskIQ scores. Read the separate score methodology.
Inspect and reproduce
Report, figures and frozen evidence
NOAA source files were retrieved October 23, 2026. The companion evidence archive contains the original JSON, exact request URLs, SHA-256 checksums, the calculation script, machine-readable results and chart source. Running analyze.py against the frozen inputs regenerates the four result CSVs and checks completeness, daily reconciliation and the six-minute interval. No API credential is required.
The DOCX and evidence ZIP are the unchanged reviewed originals; their private-review labels and review-decision text document the prepublication version. The web article omits that internal review instruction. Extract the ZIP and run python3 analyze.py inside high-tide-review. The original chart images are reproduced here without alteration.
Sources and context
- [1] NOAA CO OPS Data API
hourly_height for stations 8575512, 8638610 and 8570283; water_level for the Annapolis six-minute check. Parameters and exact URLs are in sources.json.
- [2] NOAA CO OPS Metadata API
Station floodlevels.json, units=metric. Threshold snapshot, not a historical threshold series.
- [3] NOAA Derived Product API
htf_daily with explicit metric/STND parameters, plus the 2025 meteorological-year annual product as reference.
- [4] City of Annapolis Flooding Data
Existing frequency and duration treatment uses a local 3.0 ft MLLW threshold. Do not merge those totals with this NOS-threshold comparison.
- [5] Town of Ocean City storm recap
October 14, 2025. Corroborates disruption during the event, not closure duration.
- [6] City of Annapolis City Dock update
August 19, 2026. Context on tidal backflow, rainfall and construction; not evidence of project effectiveness.
- [7] NOAA Coastal Inundation Dashboard
Explains differing NOS and NWS flood thresholds.
Related HomeRiskIQ research
For another view of timing, the Colorado severe-weather report-date study examines the gaps between qualifying county dates. Those gaps measure report spacing, a different quantity from gauge persistence.
The follow-up Texas coastal flood persistence study adds selected gauges at Rockport, Eagle Point and Galveston, a dated episode timeline and explicit quality and threshold checks.
For a separate view of modeled coastal exposure, explore the three-city Florida storm-surge land study. Its modeled land-area fractions answer a different question from these observed gauge readings.
Browse all research or review the HomeRiskIQ scoring methodology.