Fort Walton Beach
19.79 km² of municipal land
- 3–4 ft bin and higher
- 7.8%
- 6–7 ft bin and higher
- 2.4%
- 9–10 ft bin and higher
- 0.3%
- Unclassified / NoData
- 83.7%
NoData is included in the land total and does not establish dry or safe land.
Three-city research pilot · Published October 13, 2026
Compare the land NOAA maps in a modeled Category 3 high-tide scenario in Fort Walton Beach, Punta Gorda and Destin. Each percentage uses the entire city's Census land area, including land with no reported depth class.
A modeled, near-worst-case scenario. These are mapped land-area fractions, not a current event, flooding probabilities, evacuation zones or HomeRiskIQ scores. Unclassified land must not be read as dry or safe.
Same source, same denominator rule
Shares of all municipal land in the indicated bin or higher. Threshold columns overlap; they must not be added together. A larger mapped share is not a ranking of safety.
19.79 km² of municipal land
NoData is included in the land total and does not establish dry or safe land.
40.03 km² of municipal land
NoData is included in the land total and does not establish dry or safe land.
19.10 km² of municipal land
NoData is included in the land total and does not establish dry or safe land.
Explore the land footprint
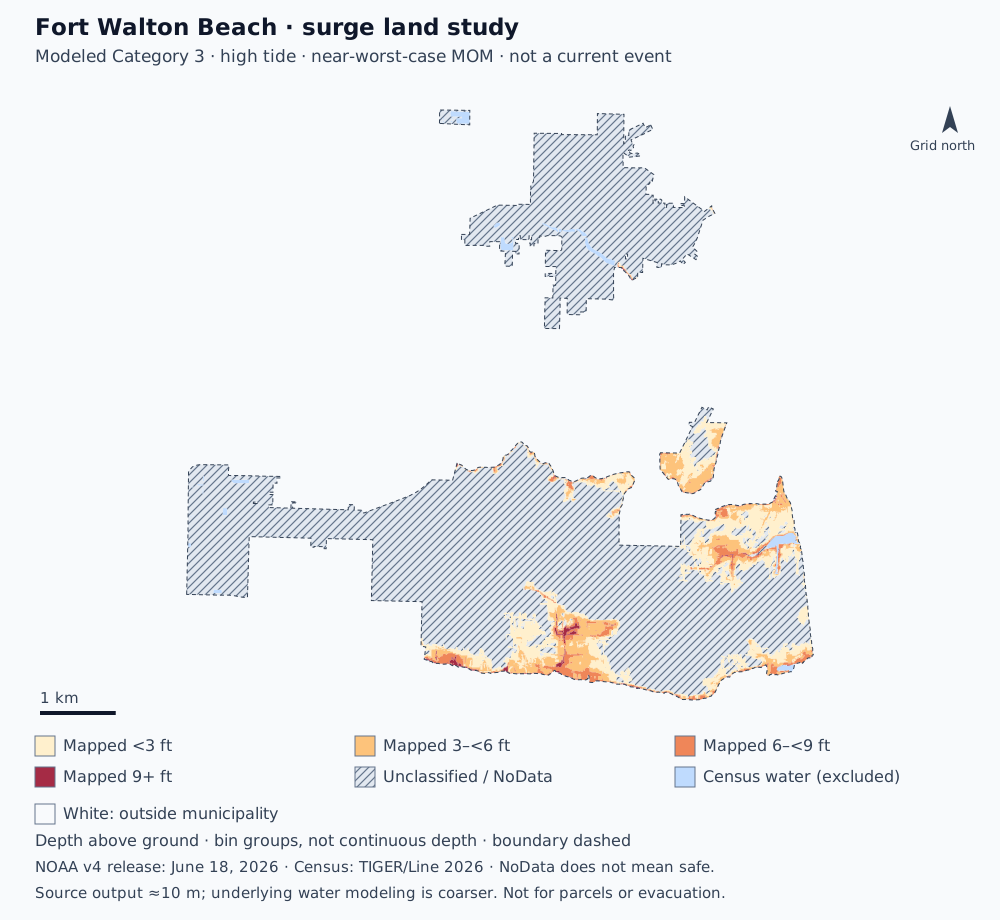
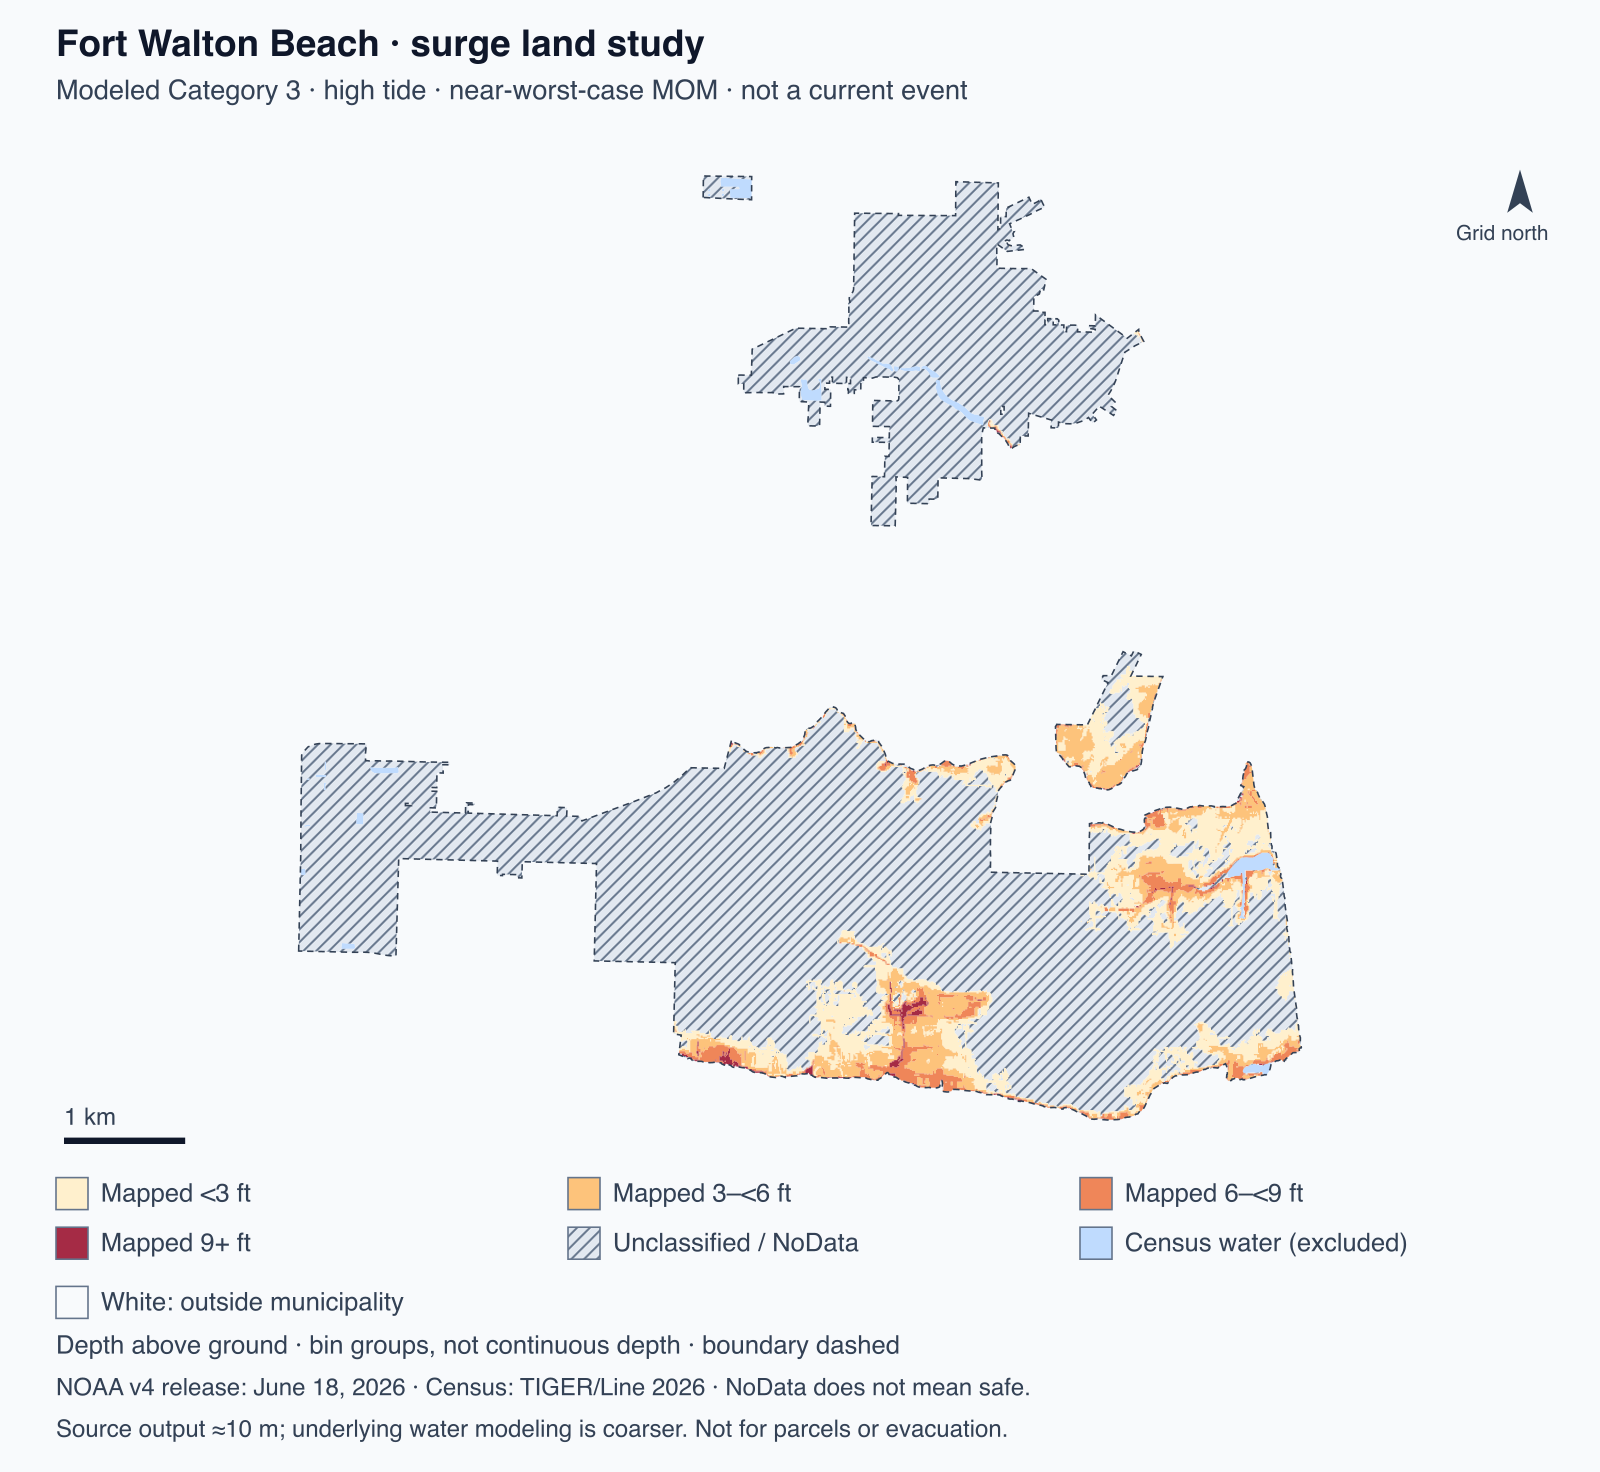
The colors group mapped depth bins in feet above ground. Hatched gray is unclassified land; blue is Census water, excluded from the percentages. White is outside the municipality.
19.79 km² of Census land · 0.20 km² of Census water excluded
The municipal boundary includes detached areas. Most city land has no reported depth class in this file; do not interpret that as safety.
Mutually exclusive groups. NoData stays in the denominator.
| Mapped class | km² | Land % |
|---|---|---|
| Mapped <3 ft | 1.69 | 8.5% |
| Mapped 3–<6 ft | 1.07 | 5.4% |
| Mapped 6–<9 ft | 0.42 | 2.1% |
| Mapped 9+ ft | 0.06 | 0.3% |
| Unclassified / NoData | 16.55 | 83.7% |
| Levee special class | 0.00 | 0.0% |
| All Census land | 19.79 | 100.0% |
83.7% unclassified. NoData can include land with no mapped inundation, masked areas or areas without usable support. This file does not identify the reason for each cell. It does not establish dry or safe land.
Bin labels are shorthand: 3–<6 ft uses NOAA codes 4–6; 6–<9 ft uses codes 7–9; 9+ ft uses codes 10–21. Code 99 is a special levee class, never a depth. Rounding can prevent displayed rows from summing exactly to 100%.
Method and interpretation
Area of Census municipal land intersecting a named NOAA depth class, divided by all Census municipal land. Water is excluded; unclassified land is retained.
NOAA's maximum-of-maximums (MOM) combines cell-by-cell maxima across many hypothetical storm tracks, speeds, sizes and landfall locations in a hurricane category, at a high-tide initial condition. No single storm produces this entire footprint. The category describes storm intensity, not likelihood.
Full-resolution 2026 Census PLACE boundaries are paired with the same year's county FACES. These three places contain land (L) and perennial-water (P) faces only. Their recorded areas reconcile exactly with Census ALAND and AWATER. This keeps Punta Gorda's extensive water and mapped canals out of the denominator.
Native raster row runs are intersected with every Census land face. Geographic edges are densified before calculating area in CONUS Albers (EPSG:5070). All positive-area slivers are retained. Analytical shapes are not simplified; map outlines use a 1 m display simplification only.
NOAA codes 1–21 represent depth bins in feet above ground; 99 is a special levee class; 255 is NoData. The source does not provide a separate verified dry-land class or a reason for each NoData cell. We neither fill those cells with zero nor remove them from the denominator.
A separate agent review used a native LERC decoder and a separate TIFF parser to compare every city-window pixel with the JavaScript decoder: 3,009,986 pixels, zero differences. A separate face-by-row-run intersection method reproduced the first polygon-based calculation within 0.000015 percentage points.
Land/water face totals reconcile exactly; geographic gaps and overlaps are zero. Area partitions close within 0.01 m². Halving the projection densification interval changes individual class areas by less than 0.00069 m². These are computation checks, not model uncertainty bounds, external scientific peer review or NOAA endorsement.
| City | Fractional area | Cell centers | All touched |
|---|---|---|---|
| Fort Walton Beach | 7.83% | 7.86% | 7.99% |
| Punta Gorda | 91.60% | 91.78% | 93.44% |
| Destin | 12.42% | 12.45% | 12.87% |
Counting every touched cell inflates Punta Gorda's mapped share by about 1.84 percentage points. We use fractional intersections. The sensitivity comparison is not a confidence interval. Downloaded decimals retain computational precision, not additional hazard accuracy.
Inspect and reproduce
Each data file includes the scenario, boundary vintage and NoData caveat. Keep those together with any result.
For current conditions and evacuation instructions, use official local emergency management and National Hurricane Center advisories.