Phoenix cooling index · 2025 research
Almost half of Phoenix cooling degree days fell outside summer in 2025
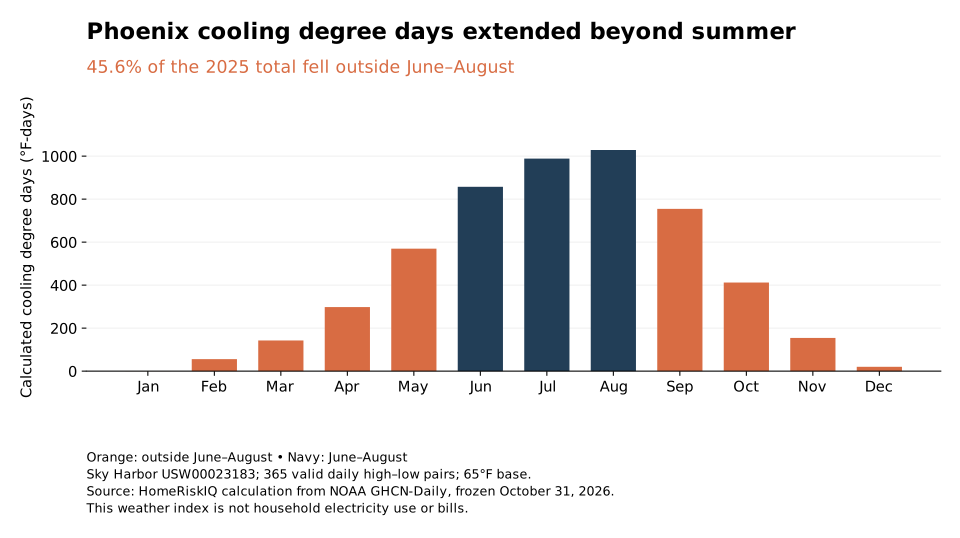
For a Phoenix household, a June-through-August picture of cooling weather leaves out a substantial part of the year. An analysis of daily temperatures at Sky Harbor found that about 46% of the airport's 2025 cooling degree days fell outside those three months. September alone contributed more than May, while October contributed more than April.
The finding is about outdoor temperature, not electricity consumption. It does not mean households spent 46% of their cooling budgets outside summer. It shows why a weather summary confined to the hottest season cannot describe the full annual temperature pattern that sits behind cooling demand.
HomeRiskIQ calculated the index from all 365 daily high–low temperature pairs at NOAA station USW00023183. No day was missing either temperature or carried a nonblank NOAA quality flag for those elements. The primary calculation retained the precision of the archived measurements rather than rounding each day's temperatures to whole degrees. NOAA daily observations
| Month | Valid days | Calculated CDD65 (°F-days) | Whole-F rounding CDD65 |
|---|---|---|---|
| Jan | 31 | 0.48 | 1 |
| Feb | 28 | 55.80 | 61 |
| Mar | 31 | 142.62 | 148 |
| Apr | 30 | 297.87 | 305 |
| May | 31 | 569.64 | 581 |
| Jun | 30 | 857.25 | 862 |
| Jul | 31 | 988.50 | 996 |
| Aug | 31 | 1,028.37 | 1038 |
| Sep | 30 | 754.56 | 761 |
| Oct | 31 | 412.14 | 418 |
| Nov | 30 | 154.50 | 159 |
| Dec | 31 | 20.19 | 24 |
Scroll the table horizontally on smaller screens. Full-precision values and definitions are in the chart-data CSV and evidence ZIP.
A unit of warmth rather than a count of hot days
A cooling degree day is not simply a date when the temperature crosses a threshold. Using a 65°F base, a day whose average high and low is 80°F contributes 15 degree days. A day averaging 70°F contributes five. A day averaging 65°F or less contributes zero. Adding those amounts produces a temperature-based measure of cooling conditions over time. The U.S. Energy Information Administration uses this measure in energy analysis. EIA degree day explanation
That distinction matters. A run of moderately warm days can contribute a substantial total even without producing the year's most memorable high temperature. In this calculation, June through August contributed about 2,874 Fahrenheit degree days, while the other nine months contributed about 2,408. The full-year sum was about 5,282.
The monthly distribution shows where the non-summer contribution occurred. September supplied about 755 degree days, May 570, October 412 and April 298. November added about 155, slightly more than March's 143. January's contribution was less than one degree day. The result is not an argument that all months impose similar cooling conditions; it is a way to see the substantial shoulders around the hottest three months.
Rounding changes the total but not the conclusion
There is an important convention check. The National Weather Service's 2025 Phoenix review reports 5,354 cooling degree days, not the approximately 5,282 calculated from unrounded converted observations here. Rounding each converted daily high and low to a whole Fahrenheit degree, then rounding their average to a whole degree before calculating the index, reproduces that published annual total. Under that convention, the share outside June–August is 45.9%, compared with 45.6% under the unrounded calculation. NWS 2025 review
Neither number should be silently substituted for the other. The downloadable daily and monthly tables retain both methods. Their agreement at the practical level supports the simpler conclusion: nearly half of the year's temperature-based cooling index accumulated outside meteorological summer.
This is a one-year station analysis, not evidence that Phoenix's cooling season is lengthening. It does not compare 2025 with a climate normal, estimate the effect of climate change or describe the temperature inside every home. Sky Harbor is one observing location, not a population-weighted average of the metropolitan area.
Nor is 65°F a universal thermostat setting or the precise outdoor temperature at which every building needs cooling. Insulation, shade, equipment, occupancy and humidity are absent from this calculation. The index cannot translate directly into kilowatt-hours, bills or the correct size of an air conditioner. Changing the calculation base to 60°F produces an outside-summer share of 50.9%; using 70°F produces 39.9%. The headline uses 65°F, not a base-independent result.
For readers evaluating claims about home cooling, the useful question is therefore not just how hot the summer became. It is also which months a weather-based comparison includes, which temperature base it uses and how the values were calculated. In Phoenix's 2025 record, the dates outside June through August are too large a contribution to leave invisible.
Methods and data: observations retrieved October 31, 2026; calendar 2025 as dated in GHCN-Daily; 65°F high–low mean calculation, with whole-degree and alternative-base sensitivity tables. This is a descriptive weather index, not a household energy or property-risk estimate.
Methods and interpretation limits
Frozen government observations were retrieved October 31, 2026 and may be revised later. These are descriptive calculations for one named station, gauge or monitoring well, not household exposure, energy use, damage, climate trends or national rankings.
The 65°F index retains converted measurement precision: 45.6% fell outside June–August. Whole-Fahrenheit rounding yields 45.9% and the NWS annual total of 5,354. Neither method is household electricity use, bills or indoor temperature.
Read the full archived methodology. The evidence ZIP preserves frozen source files, source provenance and reproduction scripts.
Sources and context
Data and chart downloads
The evidence download is shared with the related studies that use the same source files. Keep the original folder layout when extracting it. Source and sensitivity records retained for reproducibility do not constitute additional published stories.