Minnesota AQI timing · 2025 research
A nine day county AQI episode outlasted the Twin Cities stretch in 2025
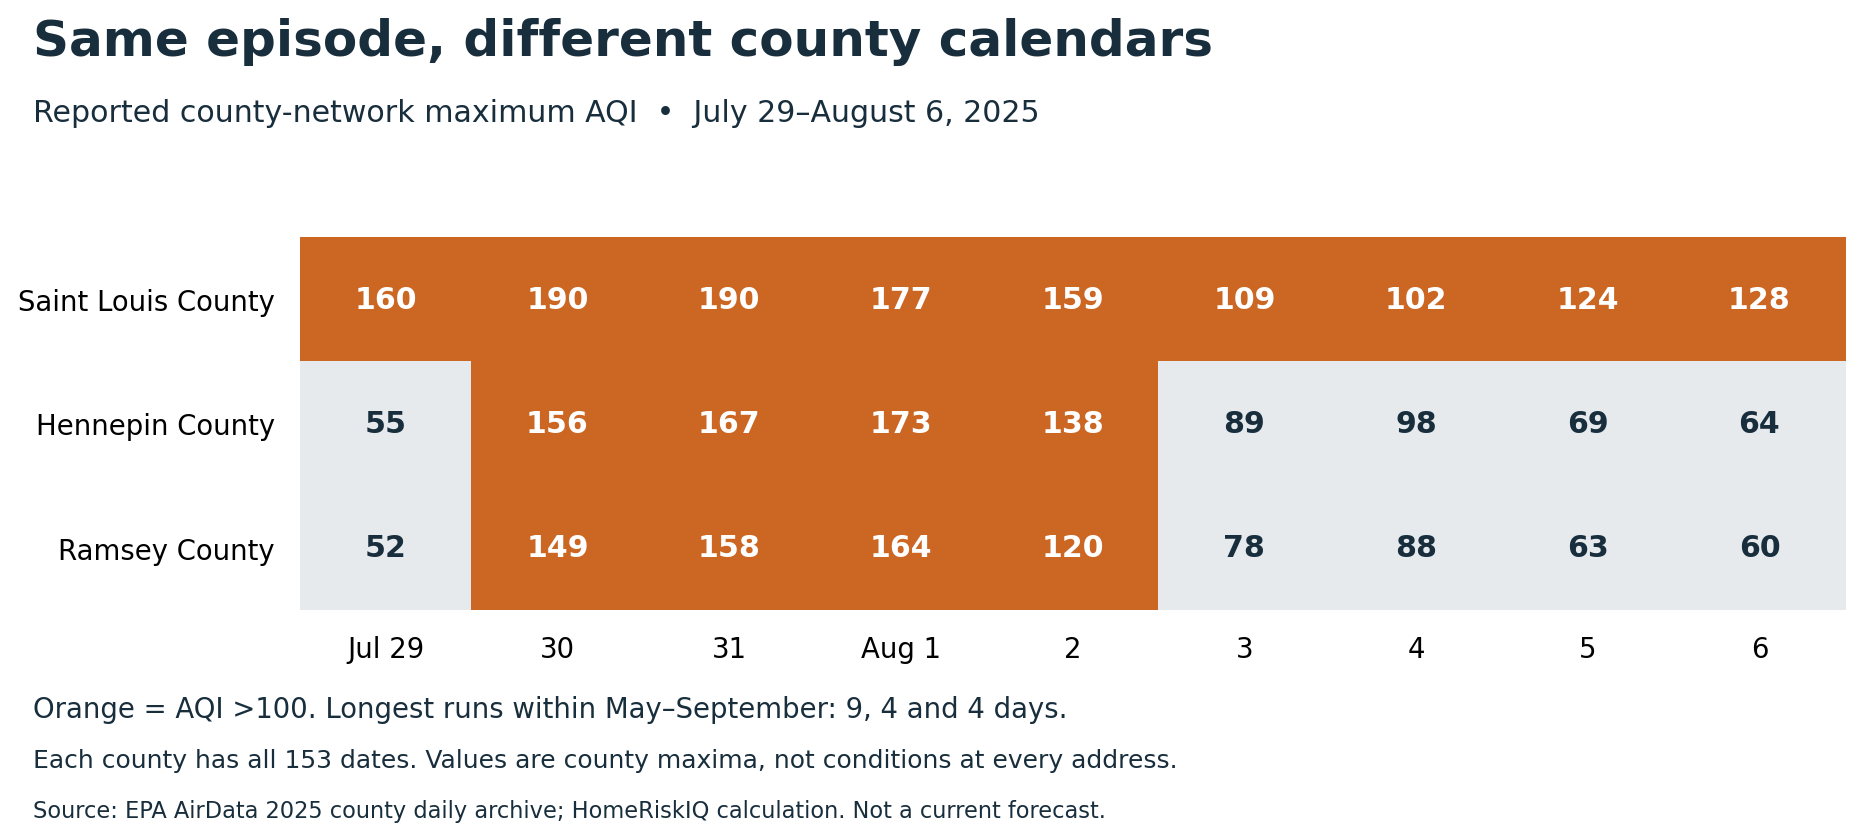
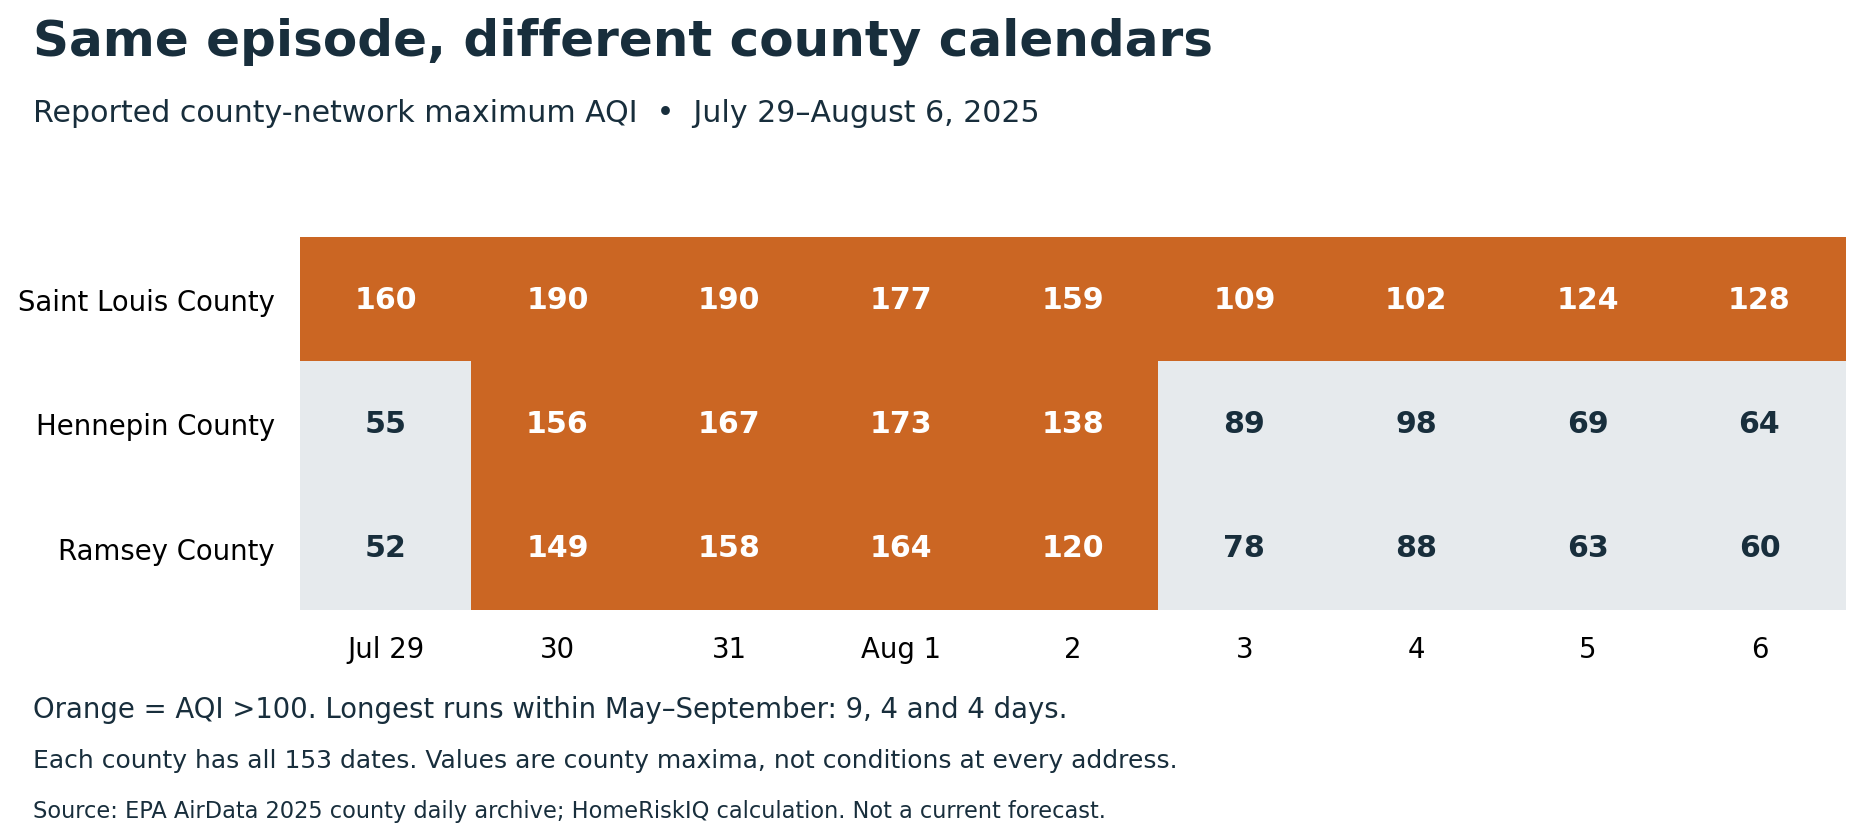
Saint Louis County's reported air-quality index stayed above 100 for nine consecutive dates from July 29 through August 6, 2025. Hennepin and Ramsey counties crossed that threshold for four consecutive dates during the same episode, July 30 through August 2. The difference is visible in the daily calendar, even though all three counties shared the middle of the event.
HomeRiskIQ calculated those runs from the EPA's 2025 county daily AQI archive, using a common May 1–September 30 window. All three counties had a reported value on each of its 153 dates. Above 100 means the AQI category was Unhealthy for Sensitive Groups or worse; it does not mean every date fell in the separate Unhealthy category, which begins at 151.
The late-July episode illustrates why a statewide account cannot describe every county's timing. On July 29, the reported AQI was 160 in Saint Louis County, compared with 55 in Hennepin and 52 in Ramsey. On August 3, the Twin Cities counties were below the selected threshold while Saint Louis remained above it. That difference continued through August 6. It is a comparison of reported county values, not proof that a plume crossed a particular home or that one resident experienced a longer exposure.
Across the full five-month window, Saint Louis had 23 dates above 100, compared with 10 in Hennepin and nine in Ramsey. Those counts describe frequency. The nine-day versus four-day runs describe persistence. Neither measure alone captures the other, and this analysis does not rank every Minnesota county or claim a long-term trend.
| County | 07-29 | 07-30 | 07-31 | 08-01 | 08-02 | 08-03 | 08-04 | 08-05 | 08-06 |
|---|---|---|---|---|---|---|---|---|---|
| Saint Louis | 160 | 190 | 190 | 177 | 159 | 109 | 102 | 124 | 128 |
| Hennepin | 55 | 156 | 167 | 173 | 138 | 89 | 98 | 69 | 64 |
| Ramsey | 52 | 149 | 158 | 164 | 120 | 78 | 88 | 63 | 60 |
Scroll the table horizontally on smaller screens. Full-precision values and definitions are in the chart-data CSV and evidence ZIP.
The county number is not a reading everywhere
EPA's geographic AQI display uses the highest daily value among reporting monitors. Saint Louis County is therefore not interchangeable with Duluth, Ely or a particular neighborhood. The county archive listed three to five reporting sites per day in Saint Louis, four to nine in Hennepin, and one to three in Ramsey during the selected window. A site can measure more than one pollutant, so these are site counts, not instrument counts.
The monitor checks add an important distinction. Saint Louis County's nine-day run also appeared at the Laura MacArthur School site in Duluth. That makes the episode more than a sequence assembled solely by switching between sites. It still does not establish conditions throughout Duluth or the wider county. In a stricter sensitivity restricted to site–pollutant–POC records with nonblank daily AQI on all 153 dates, Saint Louis's longest run remained nine days and Hennepin's four. Ramsey had no qualifying complete-season monitor panel, so no comparable fixed-panel result is claimed for it.
The Minnesota DNR already documented the statewide 2025 season, including the prolonged late-July event. This calendar analysis adds a narrower geographic comparison; it does not independently attribute every particulate reading to wildfire smoke.
The underlying year is deliberate. As checked October 30, 2026, EPA's bulk index still listed 2025 as the latest full calendar year, with 2026 files partial. This is an archived account, not a current forecast. Its practical lesson is about interpreting location and timing: a statewide episode, a county maximum and a neighborhood observation answer different questions. None measures indoor air, personal dose, property damage or the value of a home.
Data note
Dates with missing county values would break a run. Monitor checks retain event-inclusive observations and do not average AQIs. Seven Minnesota exact values differ between the county archive and maxima of nonblank daily pollutant-summary AQIs, but none changes whether a date exceeds 100. The county archive is the canonical source for the calendar above; monitor checks are not asserted to reproduce EPA's exact calculation. Source files, discrepancy rows and reproducible calculations accompany this article.
Methods and interpretation limits
The canonical series is EPA county daily AQI. The analysis window is May 1–September 30, 2025: 153 dates and 22 complete Saturday–Sunday pairs. Missing dates break runs; a qualifying weekend has at least one date strictly above the stated threshold. County maxima are not county averages or personal exposure.
Across the nine-county validation dataset, 24 exact daily values remain different between the county archive and maxima of nonblank daily pollutant-summary AQIs. All 1,377 of 1,377 above-100 classifications agree. This agreement does not resolve the exact discrepancies or establish algorithmic equivalence. The download retains all eight raw archives and the discrepancy rows.
Complete-season panels require nonblank AQI for every date at the stated site–pollutant–POC combination. Blank AQI does not establish missing measurements or clean air. Counties were selected after exploratory inspection; no national ranking, current forecast, causal attribution or property-level risk is inferred.
Read the full archived methodology. The evidence ZIP preserves frozen source files, source provenance and reproduction scripts.
Sources and context
Data and chart downloads
The evidence download is shared with the related studies that use the same source files. Keep the original folder layout when extracting it. Source and sensitivity records retained for reproducibility do not constitute additional published stories.