Massachusetts groundwater · 2025 research
A Massachusetts groundwater record moved more within 2025 than its endpoints showed
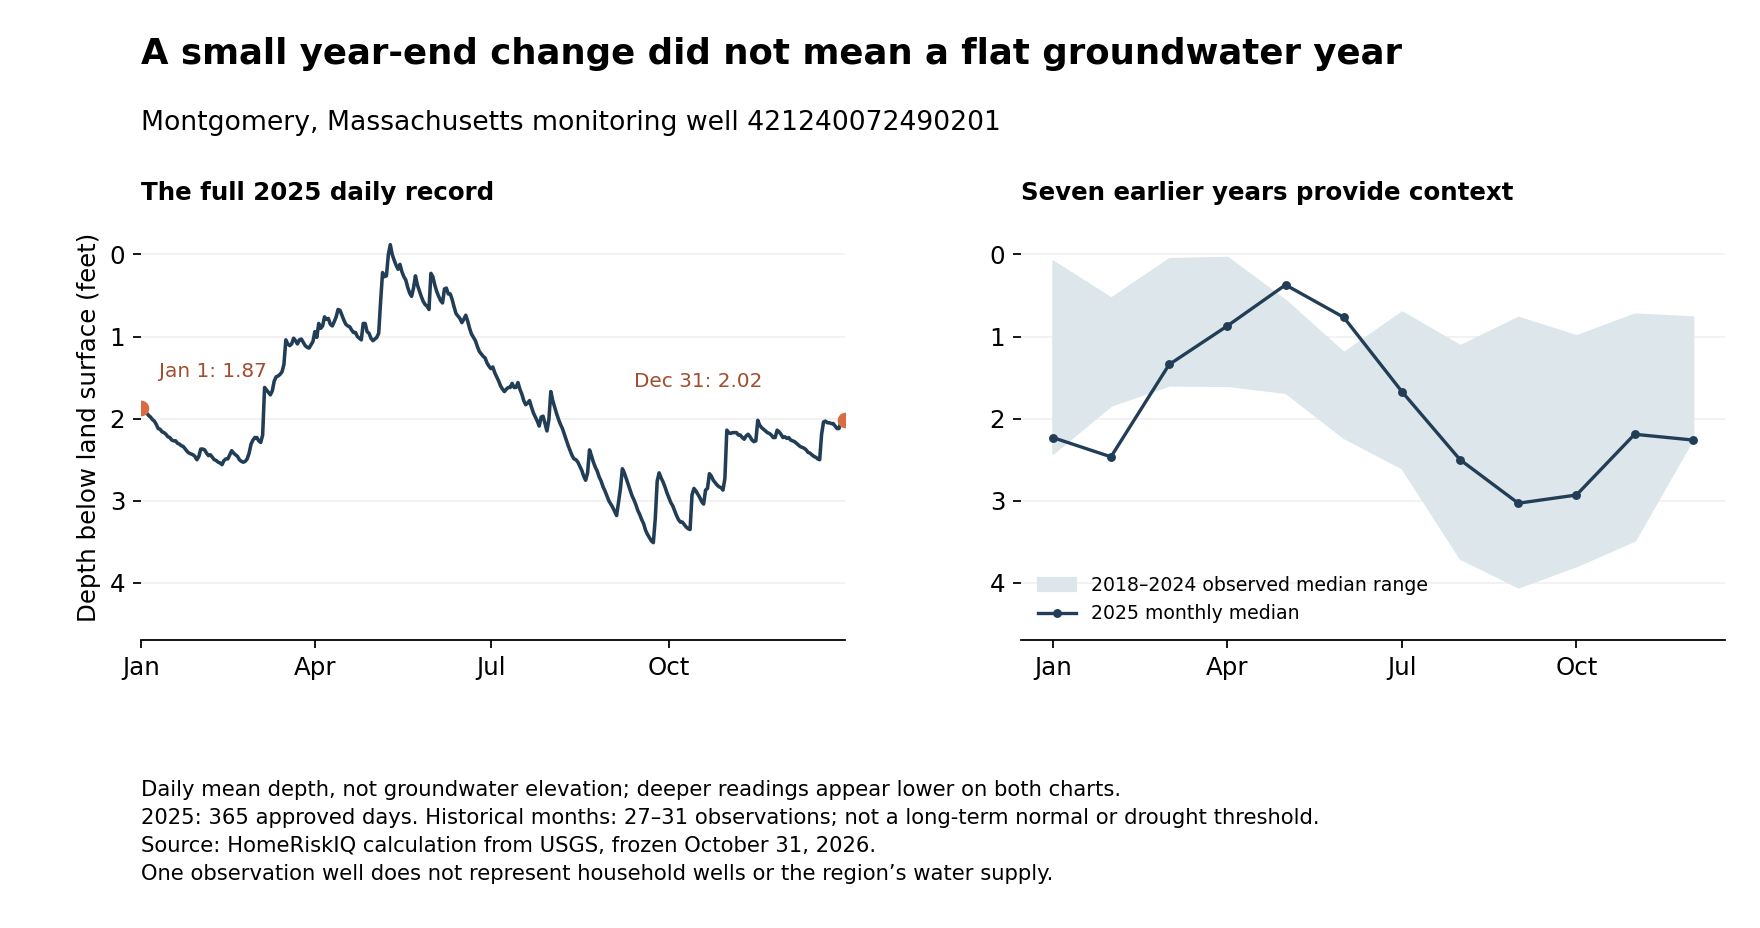
A groundwater monitoring well in Montgomery, Massachusetts, ended 2025 with its daily mean water level only 0.15 feet deeper below land surface than it began. That small endpoint change did not describe a flat year: the well's recorded daily means spanned 3.63 feet between its shallowest and deepest readings.
The result is not evidence of an extraordinary drought or a threat to nearby household wells. Earlier years at the same site had observed annual spans both smaller and larger. Instead, the record offers a concrete way to understand why a beginning-to-end comparison is an incomplete description of groundwater conditions.
HomeRiskIQ examined USGS well 421240072490201, named MA-M7W 19 Montgomery, in Hampden County. Its 2025 record contains all 365 daily mean depths, each marked Approved and without a qualifier in the retrieved file. On January 1, the daily mean was 1.87 feet below land surface. On December 31, it was 2.02 feet below land surface. USGS monitoring location
| Month | 2025 median depth (ft) | 2018–24 monthly median minimum (ft) | 2018–24 monthly median maximum (ft) |
|---|---|---|---|
| Jan | 2.23 | 0.08 | 2.42 |
| Feb | 2.46 | 0.53 | 1.83 |
| Mar | 1.34 | 0.05 | 1.59 |
| Apr | 0.87 | 0.04 | 1.59 |
| May | 0.37 | 0.56 | 1.68 |
| Jun | 0.77 | 1.20 | 2.23 |
| Jul | 1.67 | 0.70 | 2.60 |
| Aug | 2.50 | 1.11 | 3.70 |
| Sep | 3.03 | 0.77 | 4.05 |
| Oct | 2.93 | 0.99 | 3.79 |
| Nov | 2.19 | 0.72 | 3.48 |
| Dec | 2.26 | 0.76 | 2.24 |
Scroll the table horizontally on smaller screens. Full-precision values and definitions are in the chart-data CSV and evidence ZIP.
Following the path between the endpoints
The shallowest daily mean was −0.12 feet on May 10; the deepest was 3.51 feet on September 23. Because this parameter measures depth below land surface, larger positive numbers mean a deeper water level. A negative reading is above the land-surface reference. It is not a negative amount of water.
The difference between those daily means was 3.63 feet. That is a span of recorded levels, not a measure of the volume of water lost from the aquifer. The shallowest and deepest values occurred on different dates; they do not describe simultaneous conditions across the town.
Monthly medians make the progression easier to see without giving one day the whole story. The median daily depth was 0.37 feet in May, 2.50 feet in August and 3.03 feet in September. It was 2.26 feet in December. A year-end comparison compresses all of those movements into the difference between two dates.
A second chart view supplies context from the same well rather than declaring the swing unusual. Across 2018–2024, the observed annual daily-mean spans ranged from 2.07 to 4.32 feet. The 2025 span falls within that range. The chart also compares each 2025 monthly median with the range of corresponding monthly medians from those seven earlier years.
That historical window is deliberately modest. It is not a 30-year climate normal, a long-term trend analysis or an official drought percentile. Some earlier daily records are incomplete: the annual totals range from 361 to 366 observations, against 365 or 366 expected dates. Each historical month has 27–31 reported daily values. Missing dates are listed in the accompanying tables, not filled in or counted as zero.
A monitoring well is not a household water supply test
USGS identifies this site as an 18-foot-deep well, with its aquifer type coded as unconfined. Those details locate the observations in a particular physical setting. They do not establish the construction or performance of every household well nearby. USGS site metadata
A nearby household can have different well construction, aquifer conditions and pumping demands. This record cannot establish whether a particular private well will run dry, how much water a home can pump or whether that water is safe to drink. None of those outcomes was measured here.
Even a complete daily record has a time-resolution limit. USGS describes modern daily values as generally a statistic calculated from continuous observations. Here that statistic is the mean. A day's average does not reveal every rise or fall within it, so the 3.63-foot span is a range of daily means, not the full range of all instantaneous levels. USGS daily data documentation
For residents trying to understand a groundwater chart, three details are useful: what the vertical axis measures, which dates actually have observations and what comparison period supports the interpretation. At this Montgomery well, the nearly unchanged year-end depth and the substantial movement within the year are both true. Neither should be substituted for a regional drought assessment or a property's own well information.
Methods and data: USGS parameter 72019, statistic 00003, daily mean depth in feet below land surface; retrieved October 31, 2026. The station metadata include a June 2026 revision notice for field measurements expressed in elevation datums. This analysis uses the retrieved depth series and makes no conversion to those elevation datums.
Methods and interpretation limits
Frozen government observations were retrieved October 31, 2026 and may be revised later. These are descriptive calculations for one named station, gauge or monitoring well, not household exposure, energy use, damage, climate trends or national rankings.
USGS parameter 72019 and statistic 00003 measure daily mean depth below land surface, not water volume or elevation. The 3.63-foot span lies within earlier observed annual spans of 2.07–4.32 feet. Historical gaps remain; this is not a long-term normal, anomaly, drought diagnosis or household-well capacity or quality assessment.
Read the full archived methodology. The evidence ZIP preserves frozen source files, source provenance and reproduction scripts.
Sources and context
Data and chart downloads
The evidence download is shared with the related studies that use the same source files. Keep the original folder layout when extracting it. Source and sensitivity records retained for reproducibility do not constitute additional published stories.