Charleston tide hours · 2025 research
Charleston highest predicted tide hour was not its highest observed hour in 2025
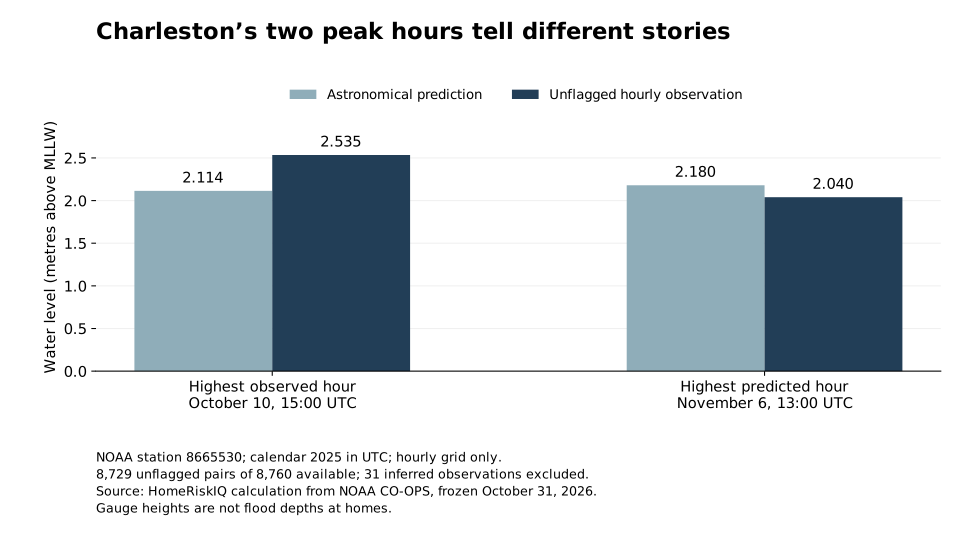
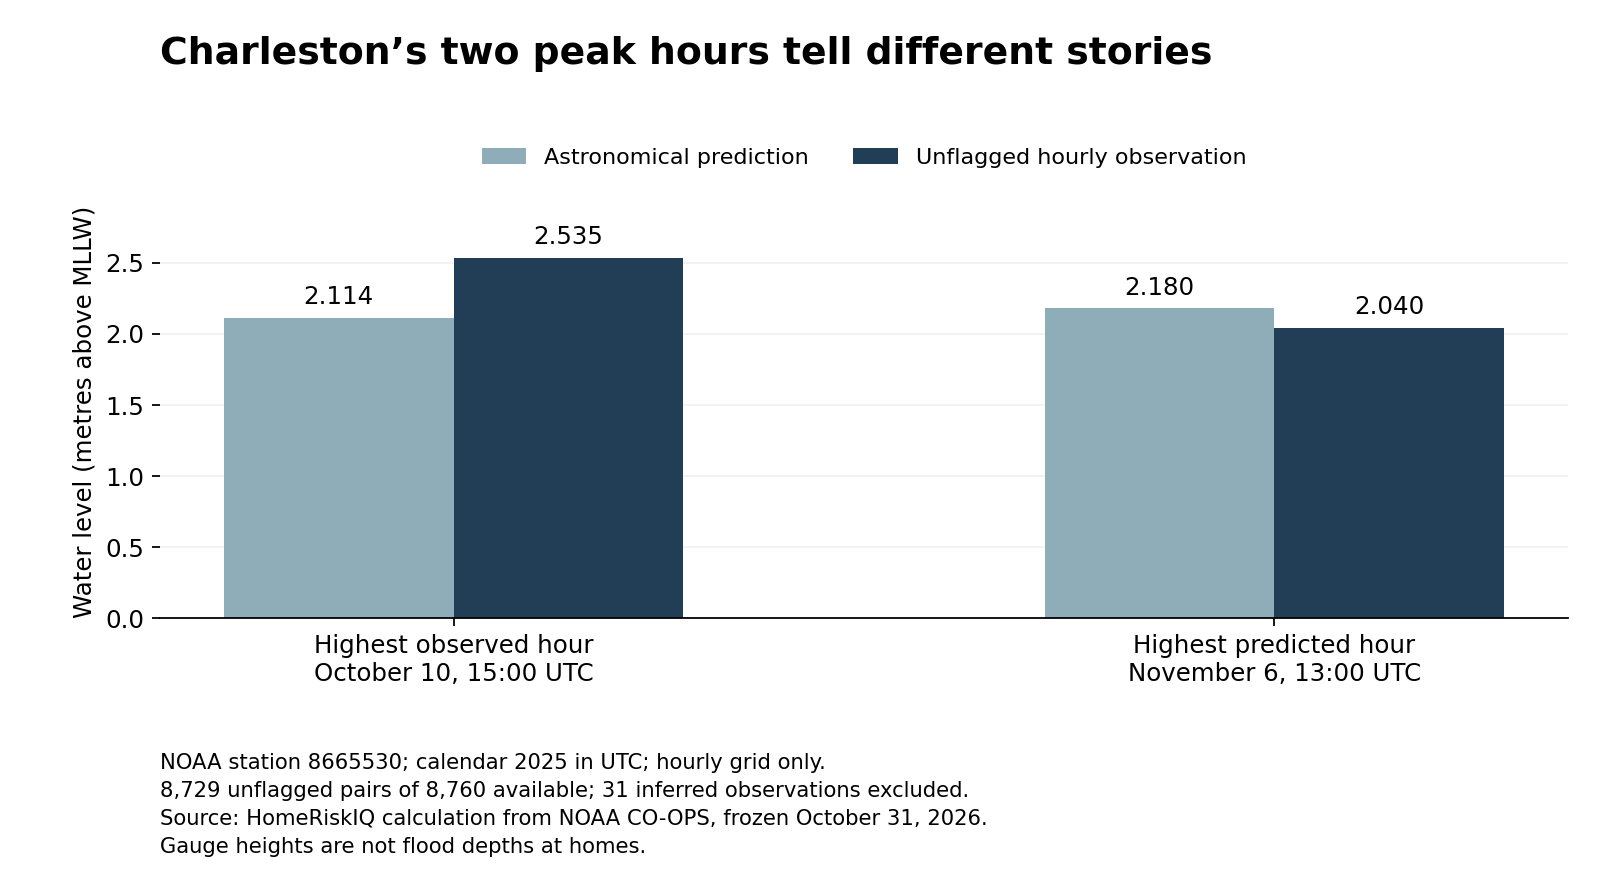
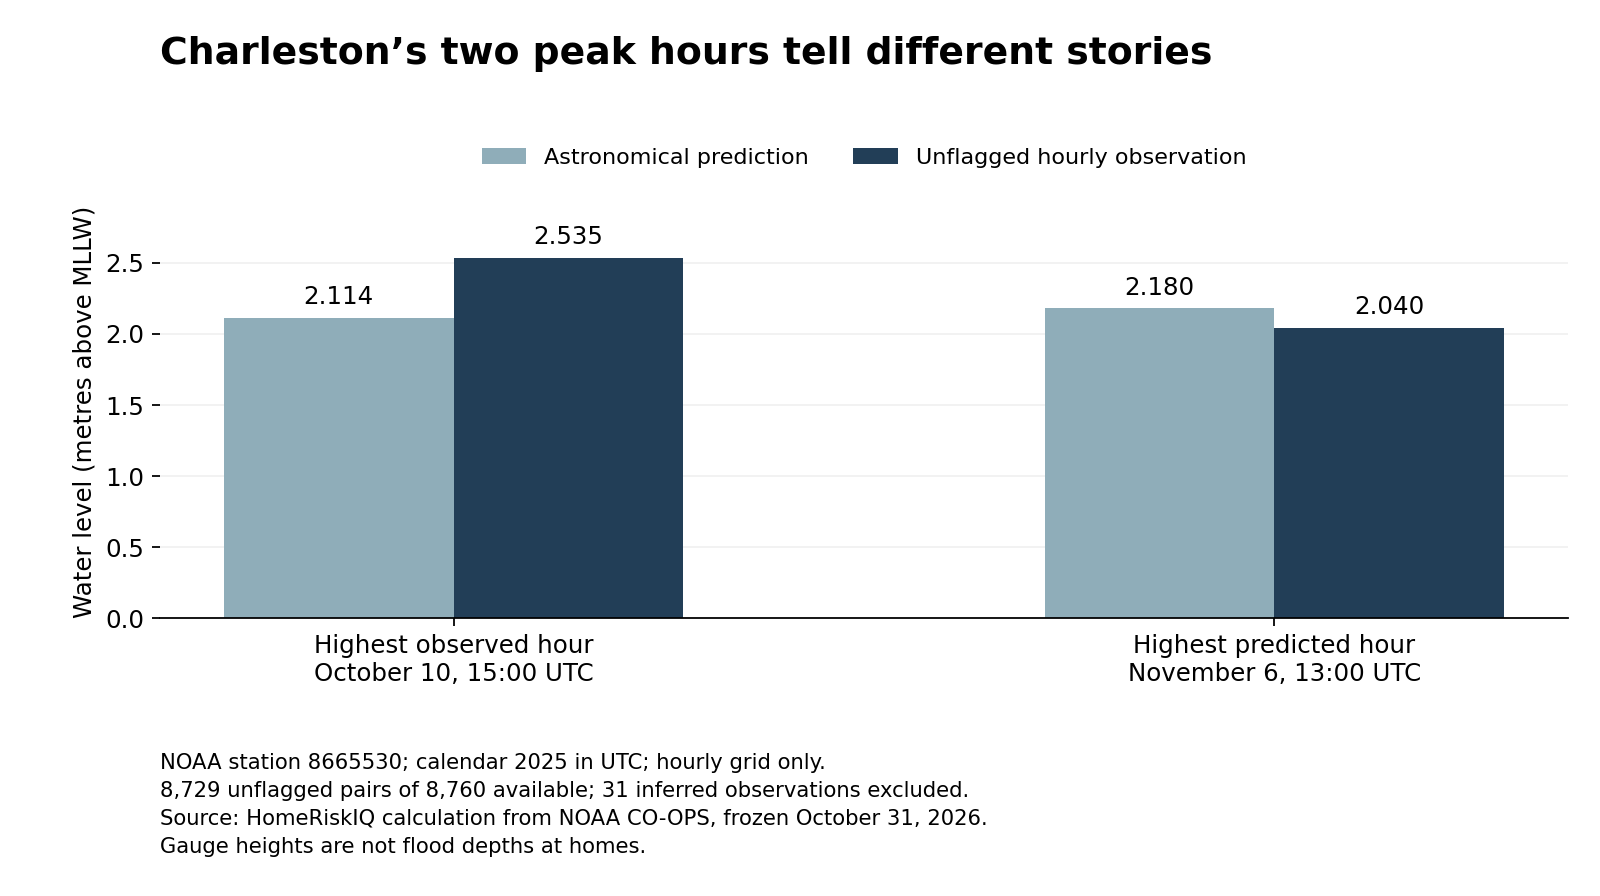
Charleston's highest astronomical tide prediction on the 2025 hourly grid occurred on November 6. Its highest unflagged observed hourly water level occurred almost a month earlier, on October 10. Putting the two records side by side shows why a tide table and an observed water-level record answer different questions.
At 15:00 UTC on October 10, NOAA's Charleston gauge recorded an unflagged hourly height of 2.535 metres above mean lower low water, compared with an astronomical prediction of 2.114 metres for that same hour. The observed level was 0.421 metres, or about 1.38 feet, higher than predicted.
At 13:00 UTC on November 6, the highest predicted hour of the year was 2.180 metres. The observation then was 2.040 metres, 0.140 metres lower than predicted. These are matched readings at one gauge, not flood depths at houses. NOAA Charleston station
| Selected hour (UTC) | Observed (m MLLW) | Predicted (m MLLW) | Observed minus predicted (m) |
|---|---|---|---|
| 2025-10-10 15:00 | 2.535 | 2.114 | +0.421 |
| 2025-11-06 13:00 | 2.040 | 2.180 | -0.140 |
Scroll the table horizontally on smaller screens. Full-precision values and definitions are in the chart-data CSV and evidence ZIP.
What a tide prediction leaves out
NOAA explains that its astronomical tide predictions account for the tide associated with the Earth, moon and sun. They do not predict the additional water-level effects of individual weather conditions, including wind, rainfall and freshwater runoff. An observed water-level record captures the resulting level at the instrument rather than just the astronomical component. NOAA tide prediction FAQ
The difference between an observation and its matching prediction is often called a residual. Here, HomeRiskIQ defines it explicitly as observed minus predicted: positive means the gauge stood above the astronomical prediction, and negative means it stood below. This sign convention should be checked before comparing charts from different products.
The October and November examples are not a test showing that NOAA's weather forecasts failed. Astronomical predictions are not the same product as short-range total-water-level forecasts. Nor does subtracting two heights identify the cause of the difference. This analysis did not estimate how much wind, pressure, runoff or any particular storm contributed.
The practical distinction for coastal residents is between a recurring astronomical baseline and the water level that actually occurred. A calendar of large predicted tides can identify dates to pay attention to, but it is not a complete record of the highest observed water and cannot replace current local warnings or forecasts.
The comparison uses hours rather than every observed crest
HomeRiskIQ retrieved NOAA station 8665530's hourly heights and hourly predictions for January 1 through December 31, 2025, using the same UTC timestamps, metric units and mean lower low water reference. All 8,760 expected hours were present in both files.
The main analysis excluded 31 hourly observations carrying NOAA's inferred-value flag, leaving 8,729 unflagged pairs. The two featured hours had neither an inferred flag nor a height-limit flag. Including the flagged observations did not change the highest observed hourly value. NOAA documents these flags separately for its hourly-height product; a verified product can still contain flagged values. NOAA API field definitions
The words “hourly” and “at the gauge” are essential. A crest between the sampled hours can be higher. These numbers must not be presented as the year's absolute maximum water level across all measurement intervals, as the height on a particular street or as the amount of water entering a building. Mean lower low water is a tidal reference level, not the elevation of a home's floor or the ground beneath it.
Charleston's October high water was already documented by public agencies. The contribution here is not the discovery of an unreported flood. It is a reproducible comparison showing that the annual high on one data product does not automatically identify the annual high on another.
For anyone reading a coastal home-risk summary, that distinction is worth keeping visible. Ask whether the chart contains astronomical predictions, observations or weather-informed forecasts; which reference level it uses; and how frequently values were sampled. In Charleston's 2025 hourly record, confusing those categories would have pointed to the wrong peak hour.
Methods and data: NOAA CO-OPS files retrieved October 31, 2026. Selection covers one named gauge and one complete calendar year, not a national station screen. No flood-day, damage, property-exposure or climate-trend estimate is made.
Methods and interpretation limits
Frozen government observations were retrieved October 31, 2026 and may be revised later. These are descriptive calculations for one named station, gauge or monitoring well, not household exposure, energy use, damage, climate trends or national rankings.
There are 8,760 matched hourly pairs, with 31 inferred observations excluded, leaving 8,729 unflagged pairs. Heights use metres above MLLW at one gauge. Hourly maxima are not full-resolution crests, street depths or property exposure; residuals do not establish causal attribution.
Read the full archived methodology. The evidence ZIP preserves frozen source files, source provenance and reproduction scripts.
Sources and context
Data and chart downloads
The evidence download is shared with the related studies that use the same source files. Keep the original folder layout when extracting it. Source and sensitivity records retained for reproducibility do not constitute additional published stories.