Arkansas flood timestamps · 2025 research
Arkansas flood timestamps show why zero does not mean dry
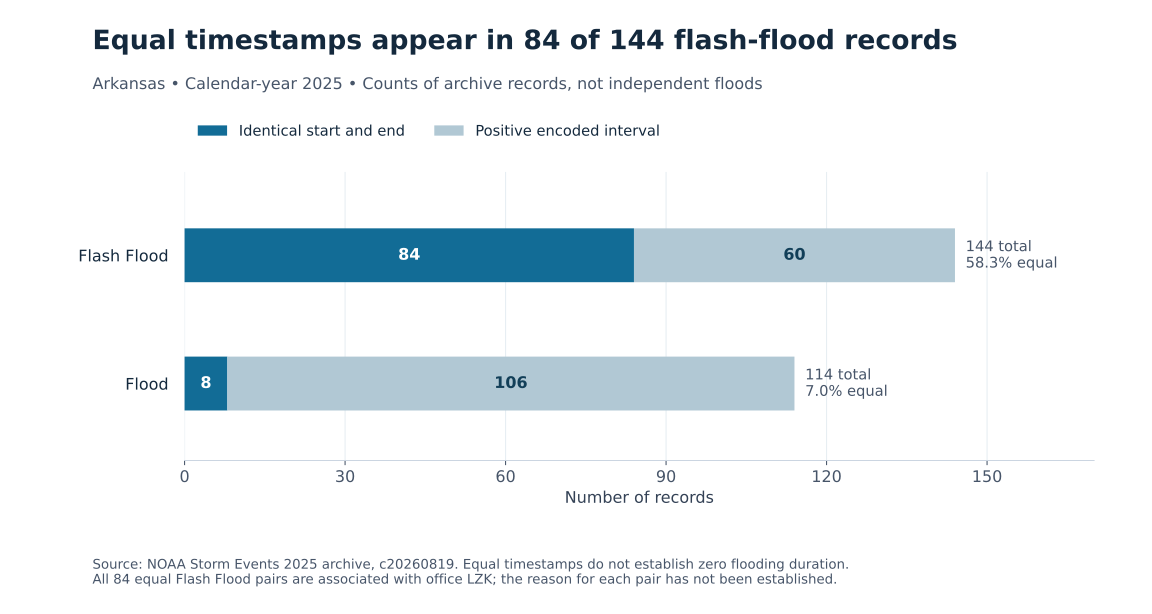
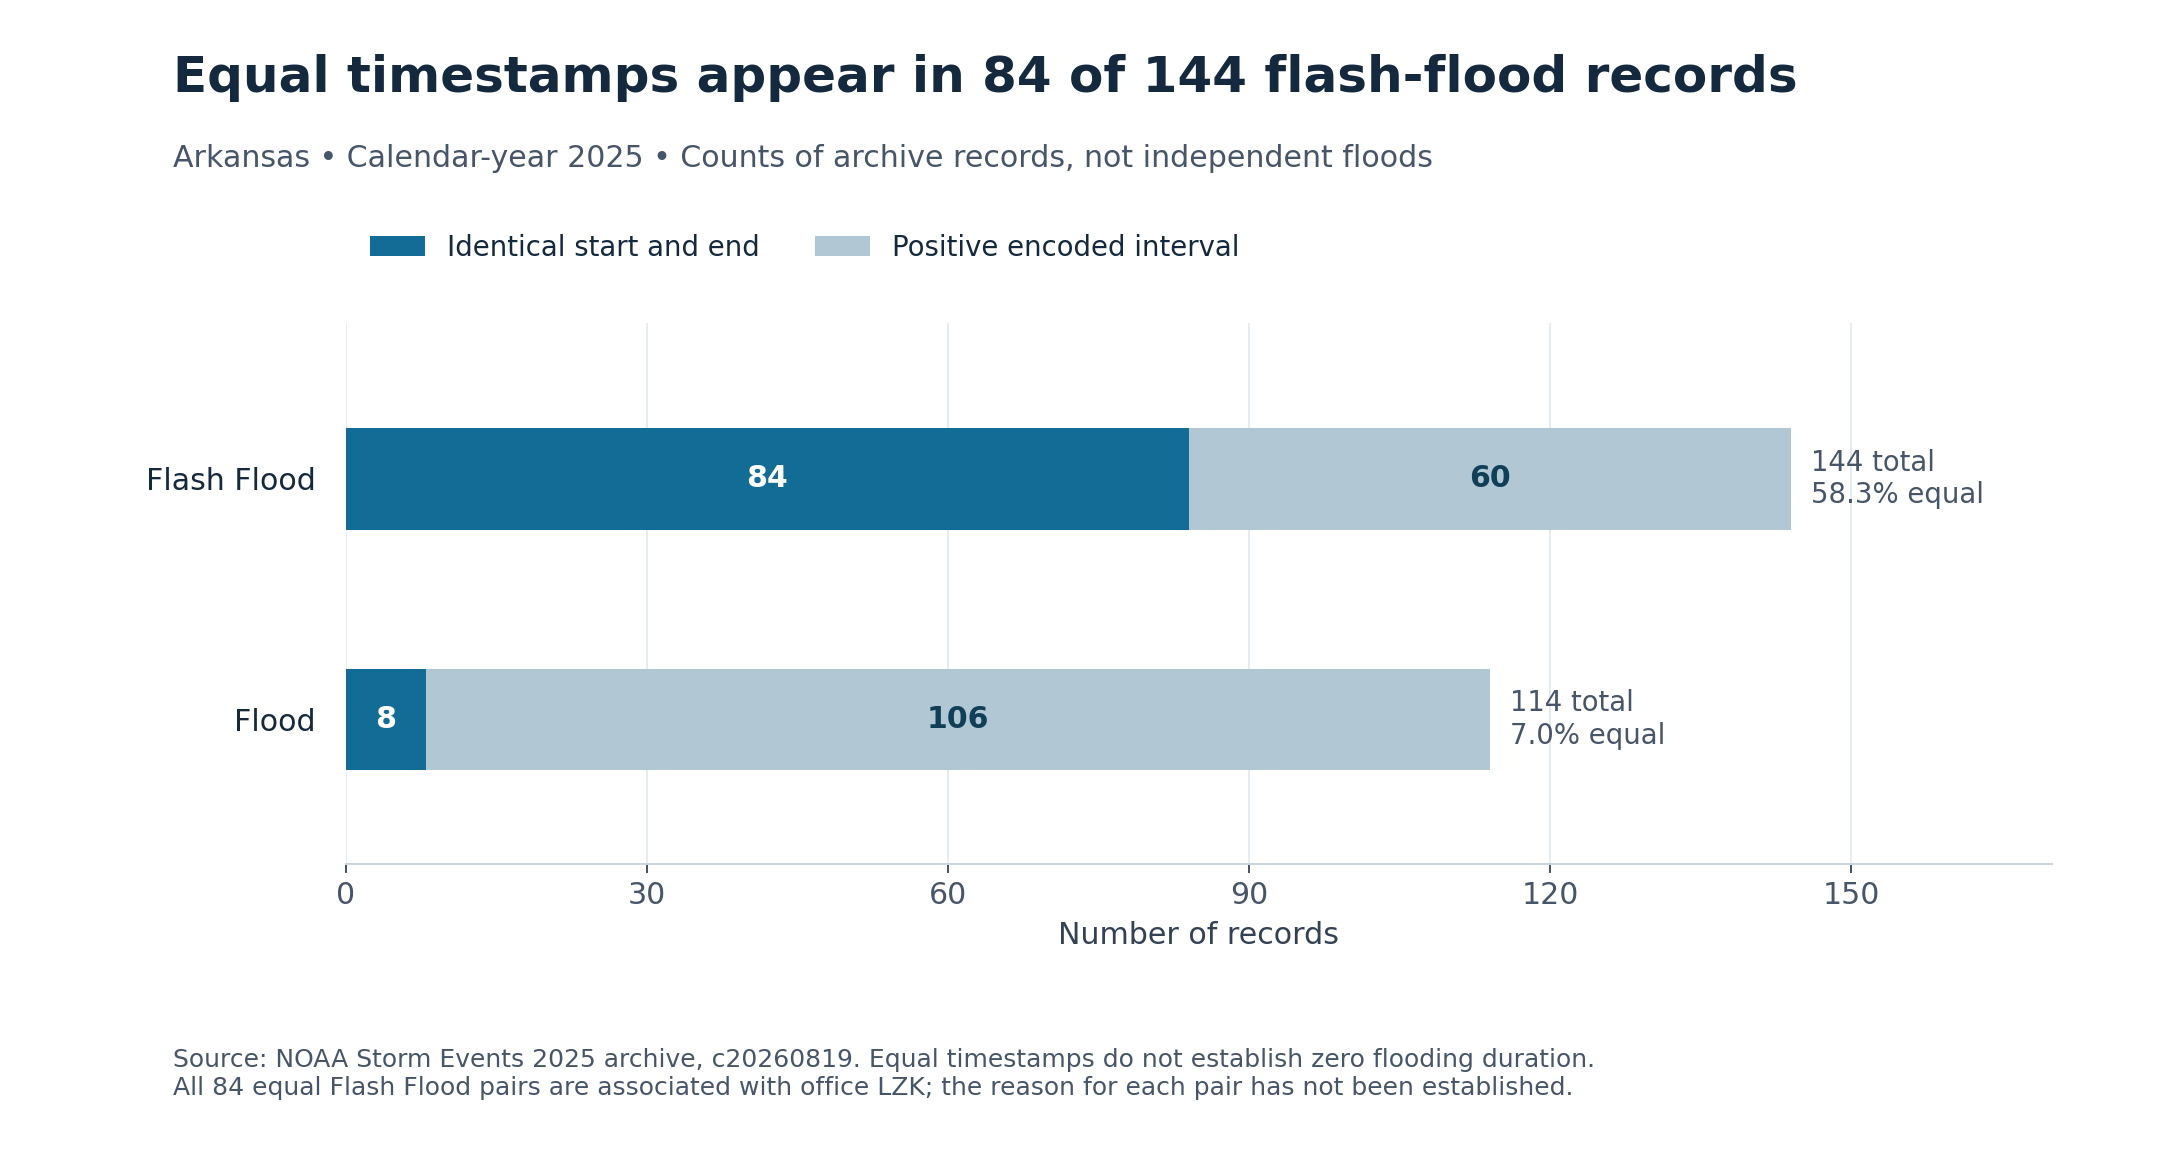
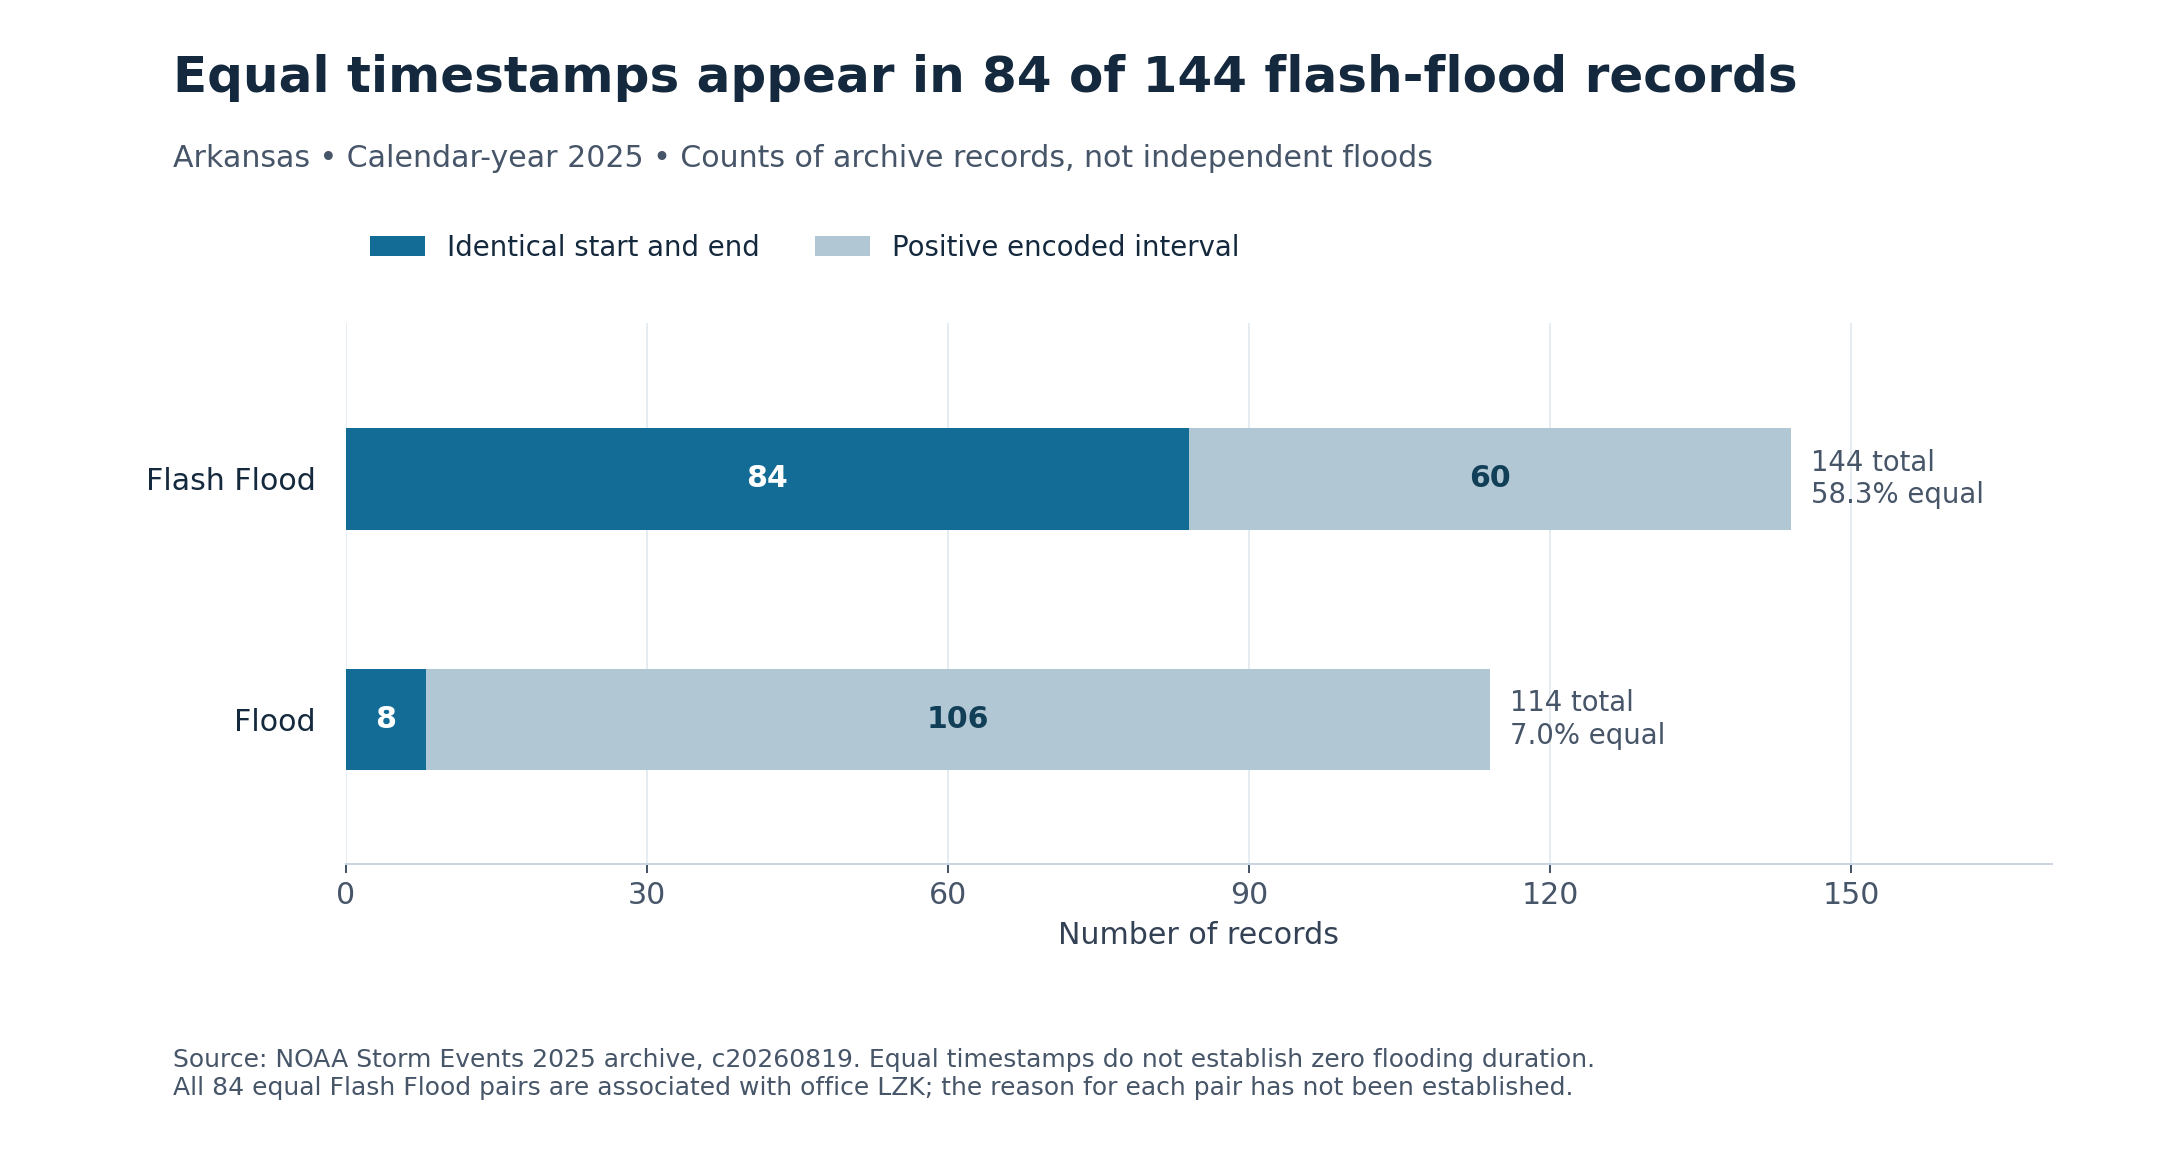
More than half of Arkansas's 2025 flash-flood records in NOAA's Storm Events archive have identical beginning and ending timestamps. A simple subtraction gives zero minutes. That result describes the entries in a database, not proof that floodwater disappeared immediately.
HomeRiskIQ examined all 144 Arkansas records labeled Flash Flood in the complete 2025 details archive, downloaded October 31, 2026. Eighty-four, or 58.3%, encode the same start and end. The finding is a warning about using historical weather databases to answer a very practical household question: how long might a road, basement or access route remain affected? NOAA source archive
What the timestamps actually say
The analysis checked the date strings against the separate year-month, day and time fields. It found no disagreement in the selected Arkansas rows, and no negative intervals. Dates on both sides of midnight were preserved rather than treating every entry as a same-day event. The equal timestamps are therefore present in the source, not introduced by subtracting time-of-day values incorrectly.
NOAA's schema identifies the fields as the beginning and ending times of an event, usually in local standard time. It does not make them a continuous water-level measurement at an individual property. This analysis has not established why each equal pair was entered, or whether any particular pair is a placeholder, an error or an intentional representation of the available report. It leaves every source value unchanged. NOAA field definitions
The accompanying narratives show why zero cannot safely be read as no impact. One January 30 entry in Faulkner County describes reported basement flooding and overflowing creeks near Vilonia. A May 24 entry in Sharp County describes a flooded low-water bridge and a road partly washed out. Both records encode zero elapsed minutes. The narratives do not establish how long those conditions lasted, but they do describe effects that a zero-duration headline would obscure.
| Record category | All records | Equal timestamps | Positive intervals | All-row median (minutes) | Positive-only median (minutes) |
|---|---|---|---|---|---|
| Flash Flood | 144 | 84 | 60 | 0.0 | 121.5 |
| Flood | 114 | 8 | 106 | 3472.0 | 4518.5 |
Scroll the table horizontally on smaller screens. Full-precision values and definitions are in the chart-data CSV and evidence ZIP.
A median that changes with the included records
Keeping all 144 Flash Flood rows yields a median encoded interval of zero minutes. Looking only at the 60 positive-interval rows yields 121.5 minutes, about two hours. The second calculation is a sensitivity check, not a corrected estimate of how long Arkansas flash floods lasted. Removing the zero pairs changes which reports are represented; it does not recover their missing physical histories.
The pattern also varies by reporting office. All 84 equal pairs are associated with the Little Rock office code, LZK, which accounts for 86 of the 144 Flash Flood rows. That concentration is important provenance information. It is not evidence of an office's motive, a staffing problem or a particular reporting practice, none of which this analysis investigated.
The separate Flood category has 114 Arkansas rows, eight with equal timestamps, or 7.0%. Its all-row median encoded interval is about 57.9 hours. Comparing that number directly with the zero-minute Flash Flood median would mix the physical distinction between hazards with differences in the recorded intervals. It would not show how long a typical resident was exposed.
Rapid onset is a different question
The National Weather Service defines flash flooding in terms of a rapid rise that begins within six hours of the triggering event. That concerns onset, not a guarantee about when water will recede. A short preparation window and a short disruption are not interchangeable. NWS flash-flood definition
For someone reading a property or neighborhood weather history, an event listing is a starting point. Useful follow-up questions include whether the narrative identifies a relevant road or waterway, whether local records document reopening or recession, and whether an actual gauge measured conditions nearby. None of those answers can be manufactured from equal timestamps.
This is an exploratory review of one state's archive, not a national data-quality ranking or a count of flood-damaged homes. Its central lesson is narrower: before a historical flood interval becomes advice about a home, check whether the source really contains the duration being claimed.
Methods and interpretation limits
The frozen NOAA 2025 details archive was retrieved October 31, 2026; its creation date is August 19, 2026. Records and episode identifiers do not automatically count independent physical storms. Administrative reporting, category selection, missing context and source revisions limit interpretation.
These purposively selected cases explain database identity, timestamps and geography. They do not estimate home exposure, future loss, climate trends or property-level risk, and do not alter the site’s scoring model.
All 84 equal Flash Flood timestamp pairs are associated with LZK, but their underlying semantics and cause remain unresolved. The positive-only median of 121.5 minutes is selection sensitivity, not a corrected physical duration; zero encoded interval does not mean no flooding.
Read the full archived methodology. The evidence ZIP preserves frozen source files, source provenance and reproduction scripts.
Sources and context
Data and chart downloads
The evidence download is shared with the related studies that use the same source files. Keep the original folder layout when extracting it. Source and sensitivity records retained for reproducibility do not constitute additional published stories.