Arizona AQI weekends · 2025 research
Pinal and Maricopa show why air quality day counts do not describe weekends
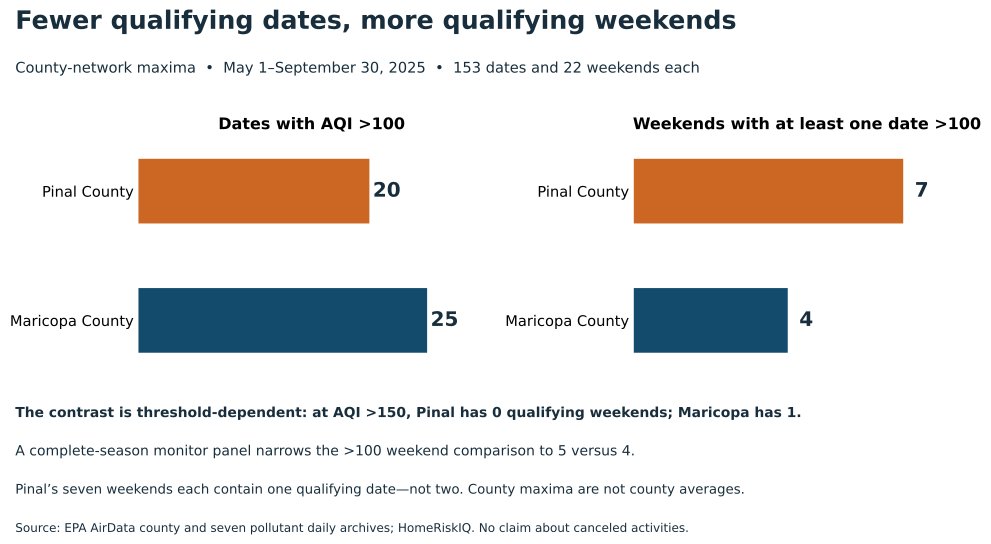
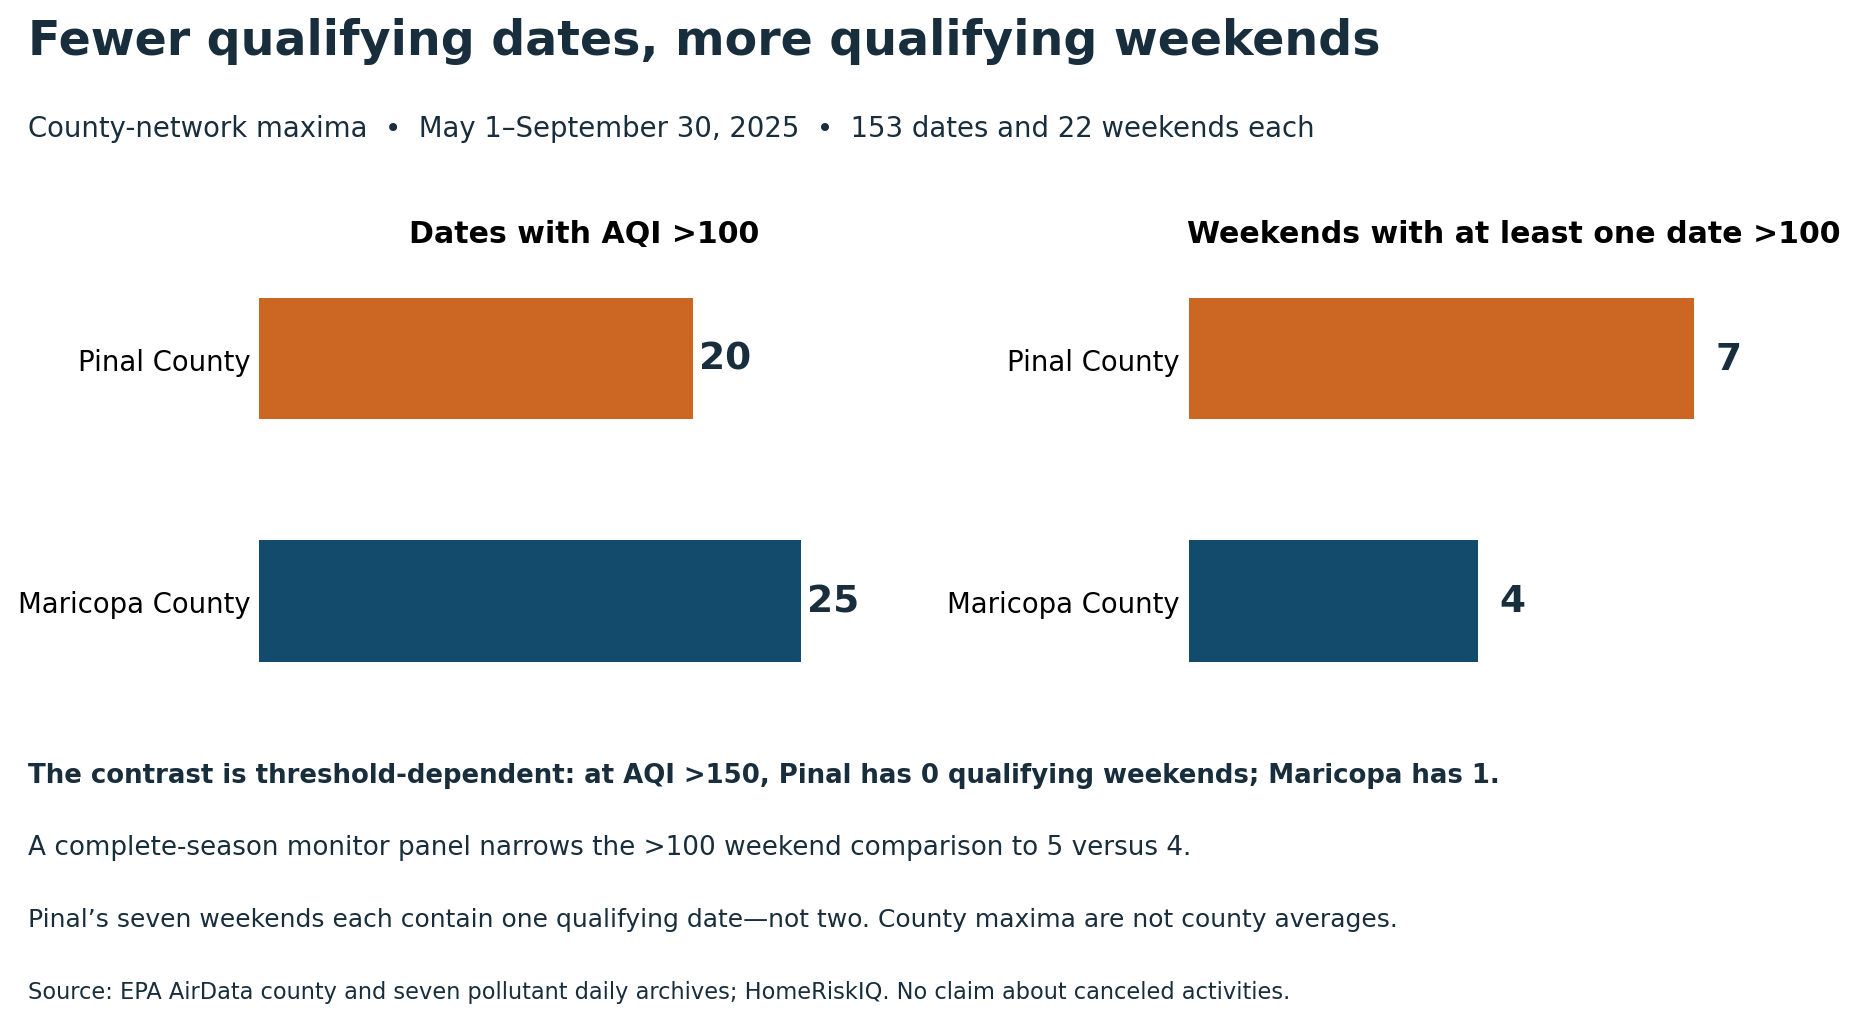
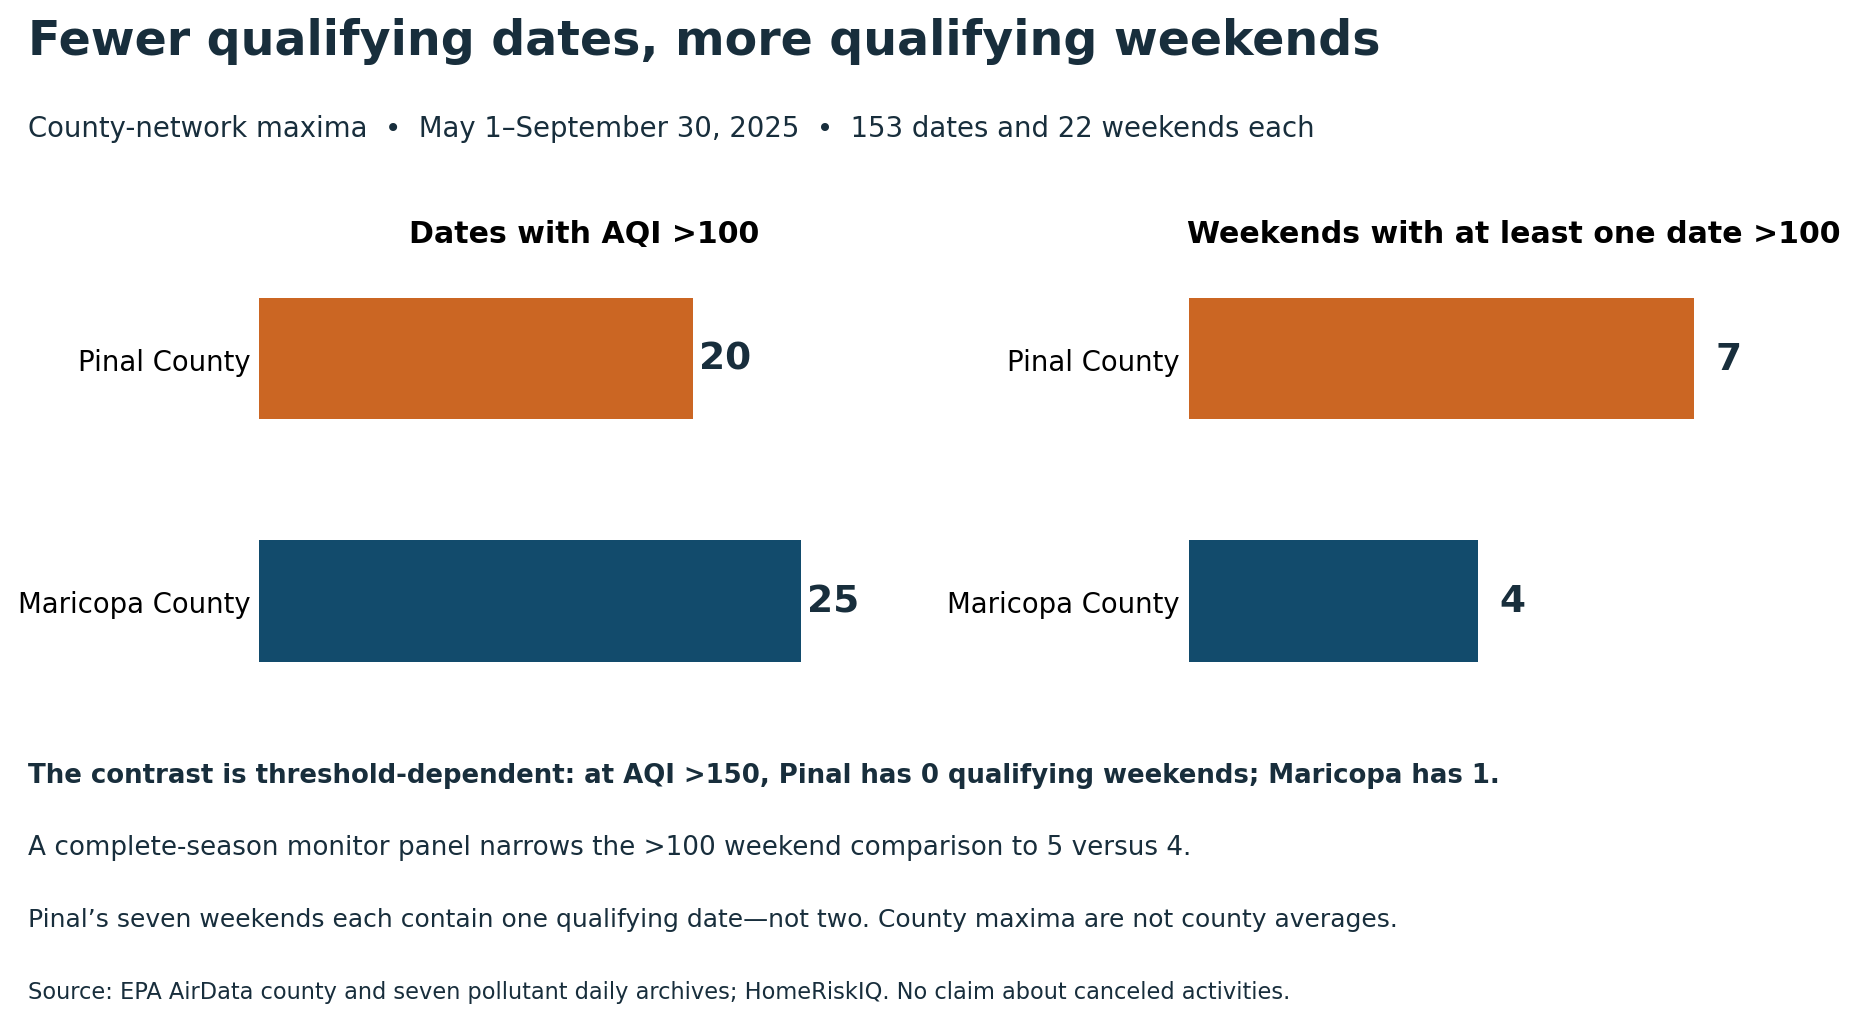
Pinal County recorded fewer dates with a reported AQI above 100 than Maricopa County from May through September 2025, yet more of its weekends included at least one such date. The result is not a ranking of which county had worse air. It is a demonstration that counting dates and counting weekends answers different questions.
HomeRiskIQ's calculation from the EPA county daily AQI archive found 20 qualifying dates in Pinal and 25 in Maricopa. Pinal's dates reached seven of the window's 22 complete Saturday–Sunday pairs; Maricopa's reached four. Both counties had a reported county value on all 153 dates from May 1 through September 30.
The distinction becomes clearer when the weekends are unpacked. Each of Pinal's seven qualifying weekends had only one date above 100. Maricopa had five qualifying weekend dates distributed across four weekends, including one with both Saturday and Sunday above the threshold. A weekend counted here is therefore not two days of elevated AQI, a canceled outing or an unusable weekend.
Above 100 encompasses Unhealthy for Sensitive Groups or worse. Raising the cutoff to above 150, the start of the Unhealthy category, changes the comparison. Pinal then had four qualifying dates and no qualifying weekends; Maricopa had five dates and one weekend. The seven-versus-four result belongs to the stated threshold and five-month window. It cannot support a general claim that Pinal's weekends were worse.
| County | Dates >100 | Qualifying weekends | Observed dates / window |
|---|---|---|---|
| Pinal | 20 | 7 | 153 / 153 |
| Maricopa | 25 | 4 | 153 / 153 |
Scroll the table horizontally on smaller screens. Full-precision values and definitions are in the chart-data CSV and evidence ZIP.
The measurement network changes the count too
The county figures are daily maxima across reporting monitors, not countywide averages. EPA listed 13–15 reporting sites per date in Pinal and 28–30 in Maricopa. Different places within each county can have different readings, and additional monitors can capture conditions that a smaller network misses. A site may contain multiple pollutant monitors.
To test dependence on reporting coverage, HomeRiskIQ repeated the calculation using only site–pollutant–POC records with a nonblank daily AQI on every date in the window. That restriction left nine such monitor records at eight Pinal sites and 45 at 24 Maricopa sites. Under this deliberately narrower panel, the weekend counts became five and four; the qualifying-date totals became 11 and 22. The weekend direction survived, but its size changed substantially. This is a sensitivity test, not a corrected estimate of county pollution.
Pollutant labels also differ. PM10 defined 16 of Pinal's 20 above-100 county dates and ozone defined four. Maricopa's corresponding split was seven PM10 dates and 18 ozone dates. A defining pollutant is the one setting the county's maximum AQI that day. These labels do not by themselves identify dust sources, wildfire smoke or responsibility for emissions.
Pinal already publishes monitoring plans and particulate-exceedance reports; this analysis does not claim to discover its particulate problem. The added information is the calendar structure and how it changes when the question changes.
For readers comparing places, the conclusion is modest but useful: ask what the number counts before treating it as a verdict. County-network AQI dates, qualifying weekends and higher-severity dates are different summaries. None establishes personal exposure, indoor conditions, health outcomes or property risk.
Data note
EPA's bulk index, checked October 30, 2026, lists 2025 as the latest full year; this article is retrospective, not a 2026 forecast. Missing dates would interrupt runs and incomplete weekend pairs would be excluded. One Maricopa exact daily value, September 14, differs between the county archive and the maximum nonblank daily pollutant-summary AQI; both are below 100. County values remain canonical, with monitor records used for explicitly labeled sensitivity checks rather than an asserted exact reconstruction.
Methods and interpretation limits
The canonical series is EPA county daily AQI. The analysis window is May 1–September 30, 2025: 153 dates and 22 complete Saturday–Sunday pairs. Missing dates break runs; a qualifying weekend has at least one date strictly above the stated threshold. County maxima are not county averages or personal exposure.
Across the nine-county validation dataset, 24 exact daily values remain different between the county archive and maxima of nonblank daily pollutant-summary AQIs. All 1,377 of 1,377 above-100 classifications agree. This agreement does not resolve the exact discrepancies or establish algorithmic equivalence. The download retains all eight raw archives and the discrepancy rows.
Complete-season panels require nonblank AQI for every date at the stated site–pollutant–POC combination. Blank AQI does not establish missing measurements or clean air. Counties were selected after exploratory inspection; no national ranking, current forecast, causal attribution or property-level risk is inferred.
Read the full archived methodology. The evidence ZIP preserves frozen source files, source provenance and reproduction scripts.
Sources and context
Data and chart downloads
The evidence download is shared with the related studies that use the same source files. Keep the original folder layout when extracting it. Source and sensitivity records retained for reproducibility do not constitute additional published stories.